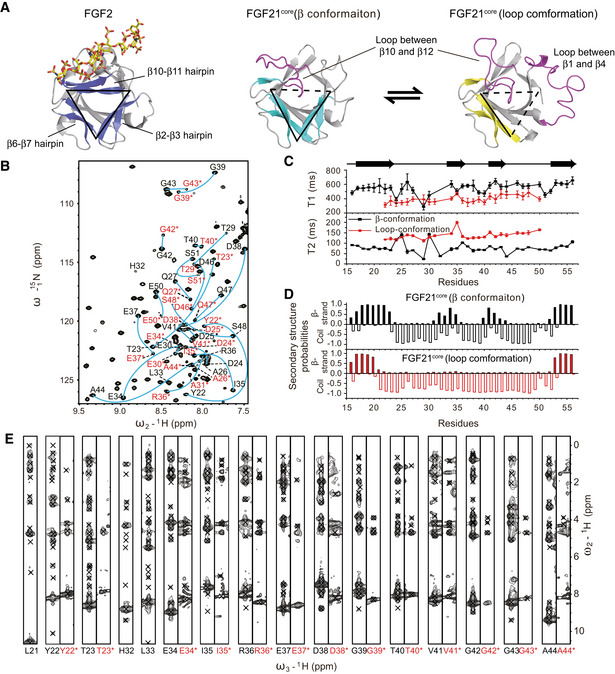
Figure 2. Dynamics caused folding instability of FGF21 in the triangular array region.

- Triangular array region of FGF2 (PDB ID: 2FGF), FGF21core (β conformation) and FGF21core (loop conformation). The edges of the triangular formed by hairpins or missed (colored magenta) are indicated by solid or dashed lines, respectively.
- 2D 1H‐15N Heteronuclear Single Quantum Correlation (HSQC) spectrum showing the two sets of assignments for residue Tyr22 to Glu50 (labeled by one‐letter amino acid code and sequence number). Labels for the loop conformation are colored red and marked with asterisks.
- 15N T1 and T2 relaxation times of the residues in β2‐β3 region. The secondary structure of FGF21core (β conformation) is shown on the top. Error bars show the fitting SDs of ten different experiments.
- Secondary structure prediction of residues in β2‐β3 region using TALOS + program. The probability of β‐strand and random coil of the residues are shown by histogram.
- 1H‐1H slices of 15N‐edited 3D NOESY‐HSQC spectrum for β2‐β3 residues. Residue codes are labeled as in (B).
