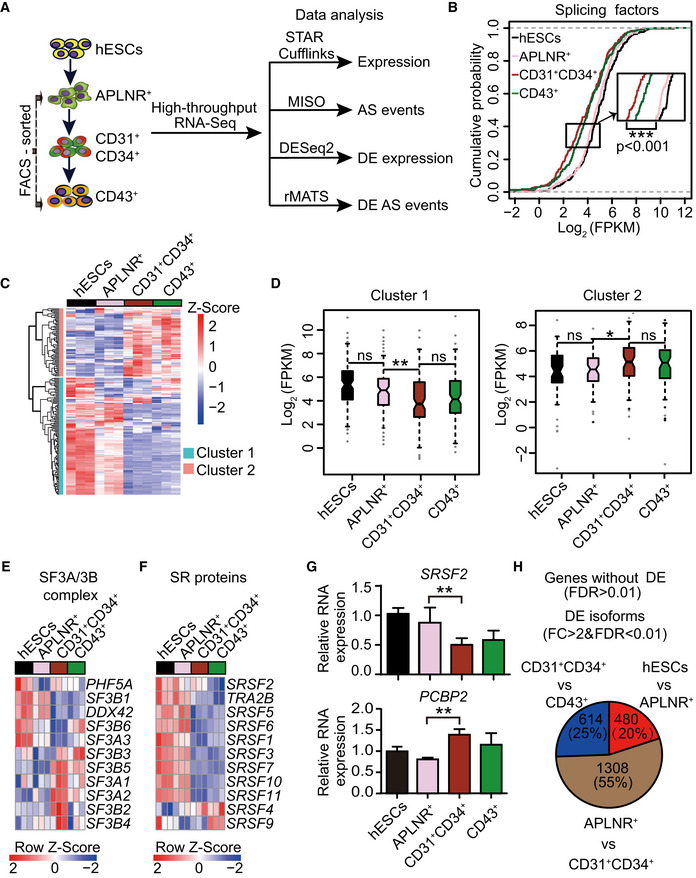
Figure 1. The dynamic alternative splicing program during hESC hematopoietic differentiation.

-
ASchematic representation of the strategies for fluorescence‐activated cell sorting (FACS) and transcriptomic analyses. During hematopoietic differentiation, human embryonic stem cells (hESCs, H1) on day 0, FACS‐purified lateral plate mesodermal APLNR+ cells on day 2, purified CD31+CD34+ endothelial progenitor cells (EPCs) on day 5, and purified CD43+ hematopoietic stem and progenitor cells (HSPCs) on day 8 were collected for RNA‐Seq, respectively. STAR Cufflinks, MISO, DESeq2, and rMATS were used to analyze the expression abundance of genes and transcripts, alternative splicing events, differentially expressed genes and transcripts, and differential splicing events, respectively. n = 3 technical replicates.
-
BCumulative distribution curves of Log2(FPKM) of splicing factors (n = 235) in hESCs APLNR+, CD31+CD34+, and CD43+ cells. The upper and lower dotted lines represent cumulative scores of 1 and 0, respectively. n = 3 technical replicates. The P‐value was calculated by a two‐tailed Wilcoxon signed‐rank test.
-
CThe heatmap illustrates the expression scaled by row of components within the major spliceosomal machinery (n = 182) using unsupervised hierarchical clustering. The heatmap was scaled with Z‐Score using the log2(FPKM) expression of components within the major spliceosomal machinery. n = 3 technical replicates.
-
DThe boxplots depict the expression of splicing factors in cluster 1 (n = 115) and cluster 2 (n = 67) identified in (C) at distinct differentiation stages. The central band indicates the median level of expression. Boxes present 25%‐75% of genes expression. The whiskers indicate the lowest and highest points within 1.5 × the interquartile. n = 3 technical replicates. P‐values were calculated by a two‐tailed Wilcoxon signed‐rank test.
-
E, FThe heatmap shows the dynamic expression of genes in the SF3A/3B complex (E) and SR family (F) at each indicated differentiation stage. Both heatmaps were scaled by row. The heatmaps were scaled with Z‐Score using the log2(FPKM) expression of indicated components. n = 3 technical replicates.
-
GThe mRNA expression of splicing regulator SRSF2 and splicing factor PCBP2 during hematopoietic differentiation was measured by RT–qPCR. The ACTB gene was used as a control. Results given are mean ± standard deviation (SD). P‐values were determined by an unpaired two‐tailed Student’s t‐test. n ≥ 3 biological replicates.
-
HThe number of differentially expressed transcripts at the isoform level (fold change (FC) > 2 & FDR < 0.01), but not at the gene level (FDR > 0.01), by comparing two consecutive differentiation stages (hESC vs APLNR+ cells, APLNR+ cells vs CD31+CD34+ cells, and CD31+CD34+ cells vs CD43+ cells).
Data information: * presents P < 0.05. ** presents P < 0.01. *** presents P < 0.001.
