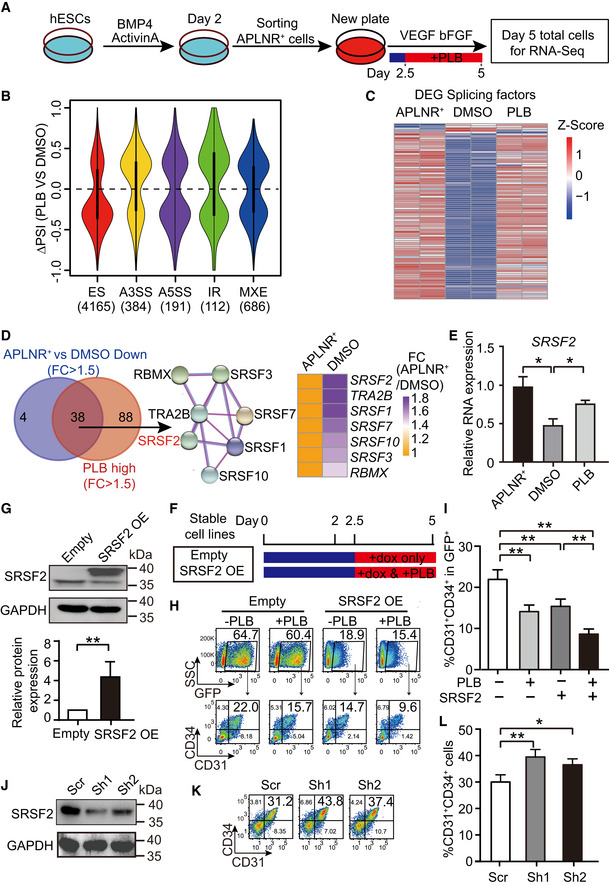
Figure 3. Disruption of the splicing factor switch impacts EPC specification.

- The schematic depicting experimental strategy for RNA‐Seq. APLNR+ cells on day 2 were FACS‐purified and treated with 1.25 nM or 2.5 nM PLB from day 2.5 to 5 during hematopoietic differentiation. Then, the day 2‐purified APLNR+ cells, day 5‐differentiated cells with or without PLB treatment were harvested for RNA‐Seq. n = 2 technical replicates.
- The violin plot represents distributions of statistically significant ΔPSI for different types of splicing events by comparison of PLB‐treated cells vs DMSO control. The number of differential splicing events regulated by 2.5 nM PLB is denoted in brackets. we analyzed the differential splicing events with genes FPKM > 1 in at least one differentiation stage. Among them, the cutoffs of PSI > 0.2 and FDR < 0.05 were used to define differential splicing events. The dotted line indicates ΔPSI = 0.
- The heatmap shows the expression of differentially expressed splicing factors in APLNR+ cells, day 5‐differentiated cells treated with DMSO or 2.5 nM PLB. The differentially expressed splicing factors were defined as fold change of FPKM > 1.5 between APLNR+ cells and DMSO‐treated cells. The heatmap was scaled with Z‐Score using the log2(FPKM) expression of differentially expressed splicing factors. n = 2 technical replicates.
- The Venn diagram presents the intersection between highly expressed genes in APLNR+ cells (APLNR+ cells vs. DMSO‐treated cells; FC > 1.5) and highly expressed genes in PLB on day 5 (PLB‐treated cells vs DMSO; FC > 1.5). The STRING diagram (middle) shows the protein interaction networks among the 38 candidates. The heatmap on the right illustrates the fold change of 7 splicing regulators between APLNR+ and DMSO‐treated cells.
- RT–qPCR showing the mRNA level of SRSF2 in APLNR+ cells and day 5‐differentiated cells without or with 2.5 nM PLB treatment. The SRSF2 expression was normalized to that in APLNR+ cells. The ACTB gene was used as a control. P‐values were determined by an unpaired two‐tailed Student’s t‐test.
- Schematic of experimental design. During hematopoietic differentiation, stable cell lines harboring SRSF2 expression vector and its corresponding empty vector control were treated with DOX alone or in combination with 1.25 nM PLB from day 2.5 to 5. The cells were harvested for analysis on day 5 of differentiation.
- The Western blotting illustrates the overexpression of SRSF2 in sorted GFP+ cells on day 5 during differentiation, which were induced with DOX from day 2.5 to 5. GAPDH was used as the loading control. The bar graph presents the quantification of SRSF2 protein expression. The P‐value was determined by an unpaired two‐tailed Student’s t‐test.
- The representative FACS plots show the frequency of CD31+CD34+ EPCs in the GFP+ population at day 5 with 1.25 nM PLB supplementation or SRSF2 exogenous expression alone or their combinational treatment from day 2.5, as described in (G).
- The bar graph represents the percentage of CD31+CD34+ cells from (H). P‐values were calculated by one‐way ANOVA followed by Tukey’s test.
- The Western blotting shows the depletion of SRSF2 in the DOX‐inducible knockdown system. GAPDH acts as the loading control.
- The representative FACS plots show the frequency of CD31+CD34+ EPCs at day 5 with or without SRSF2 depletion by administration of DOX from day 2.5 to 5.
- The bar graph representing the percentage of CD31+CD34+ cells from (K). P‐values were determined by an unpaired two‐tailed Student’s t‐test.
Data information: Results given are mean ± SD. *P < 0.05, **P < 0.01. All experiments were conducted for at least 3 biological replicates unless stated otherwise.
Source data are available online for this figure.
