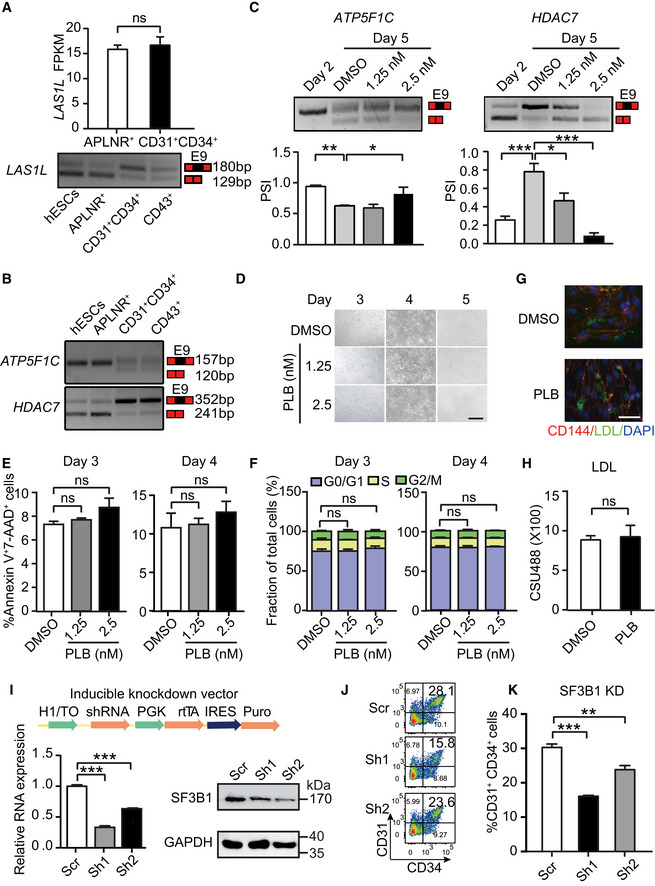
Figure EV3. Short PLB treatment exhibits minor cytotoxic effects.

- Expression of LAS1L in day 2‐differentiated APLNR+ cells and day 5‐differentiated CD31+CD34+ cells by RNA‐Seq. The bottom panel showing the inclusion/exclusion of LAS1L exon 9 during hematopoietic differentiation by RT–PCR.
- The inclusion/exclusion of exon 9 of ATP5F1C and HDAC7 detecting by RT–PCR during hematopoietic differentiation.
- The top panel is a representative RT–PCR electropherogram showing the inclusion or exclusion of exon 9 in ATP5F1C (left) and HDAC7 (right) in cells at days 2 and 5 without or with PLB treatment at indicated concentrations, respectively. The quantification of PSI is presented in the bottom bar graph. P‐values were calculated by one‐way followed by Dunnett’s test.
- The cellular morphology on days 3, 4, and 5 during hematopoietic differentiation after treatment with 1.25 or 2.5 nM PLB from day 2.5 to 5. Scale bar = 40 μm.
- Cellular apoptosis assessed using Annexin V and 7‐AAD at days 3 and 4 of differentiation by flow cytometry, with or without PLB treatment from day 2.5 to 5.
- The proportion of G0/G1, S, and G2/M cells at days 3 and 4 of differentiation, with or without PLB treatment from day 2.5 to 5, respectively. The cell cycle was determined using propidium iodide staining by flow cytometry.
- Immunofluorescent staining depicting low‐density lipoprotein (AcLDL) uptake from FACS‐sorted CD31+ cells without (DMSO) or with PLB (1.25 nM) treatment. CD144, LDL, and DAPI were stained (upper) by red, green, and blue, respectively. Scale bar = 40 μm.
- The bar graph showing the quantification of the LDL fluorescent intensity by the Volocity 3D image analysis software.
- The schematic illustrating the DOX‐inducible knockdown system with expression of SF3B1 shRNAs. The knockdown of SF3B1 was confirmed by RT–qPCR (left) and Western blotting (right) after inducing with DOX.
- The representative FACS plots of CD31+CD34+ EPCs after SF3B1 depletion at day 5 of differentiation.
- The percentage of CD31+CD34+ EPCs after SF3B1 depletion at day 5 of differentiation.
Data information: Results given are mean ± SD. P‐values were determined by Student’s t‐test in (A), (E), (F), (H), (I), and (K). ns represents no significant difference. *P < 0.05, **P < 0.01, ***P < 0.001. All experiments were conducted for at least 3 biological replicates.
Source data are available online for this figure.
