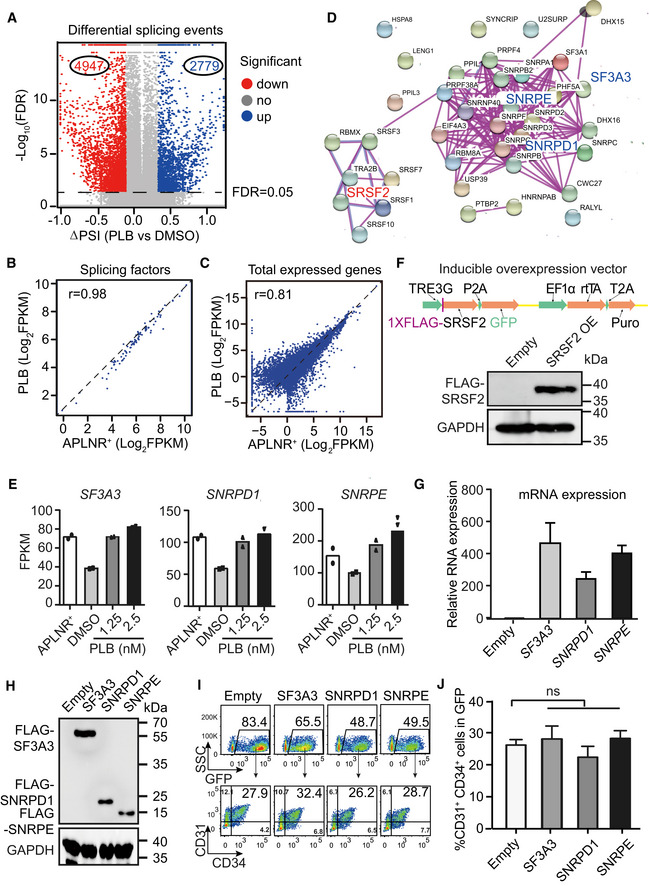
Figure EV4. Effects of ectopic expression of constitutive splicing factors on human hematopoietic differentiation.

-
AVolcano plot shows the differential splicing events regulated by PLB treated from day 2.5 to 5. The dotted line denotes FDR = 0.05.
-
B, CThe scatter plot showing the correlation of splicing factors form Fig 3c (B) and all expressed genes (C) between day 2‐APLNR+ cells and day 5‐PLB‐treated cells. r refers to the correlation coefficient.
-
DThe protein–protein interaction network of 38 intersected splicing factors (Fig 3D) (STRING: https://string‐db.org/).
-
EThe mRNA expression of SF3A3, SNRPD1, and SNRPE in day 2‐APLNR+ cells, day 5‐DMSO–treated, and day 5‐PLB‐treated cells. N = 2 technical replicates.
-
FThe upper panel illustrates the DOX‐inducible overexpression system. Western blotting confirmed the SRSF2 overexpression upon DOX induction with anti‐FLAG antibody. GAPDH was used as the loading control.
-
GRT–qPCR assay of the relative mRNA expression of SF3A3, SNRPD1, and SNRPE after overexpression upon DOX induction. The ACTB gene was used as a control. Data were normalized to the mRNA level of empty vector controls cells.
-
HWestern blotting showing the protein expression of SF3A3, SNRPD1, and SNRPE after overexpression with anti‐FLAG antibody. The GAPDH gene was used as a control.
-
IRepresentative FACS plots of CD31+CD34+ cells in SF3A3, SNRPD1, and SNRPE overexpressed (GFP+) cells.
-
JStatistical analysis of the frequency of CD31+CD34+ in SF3A3, SNRPD1, and SNRPE overexpressed (GFP+) cells.
Data information: P‐values were calculated by one‐way ANOVA followed by Dunnett’s test. ns represents no significant difference. Results given are mean ± SD.. All experiments were conducted for at least 3 biological replicates unless stated otherwise
Source data are available online for this figure.
