Figure 1.

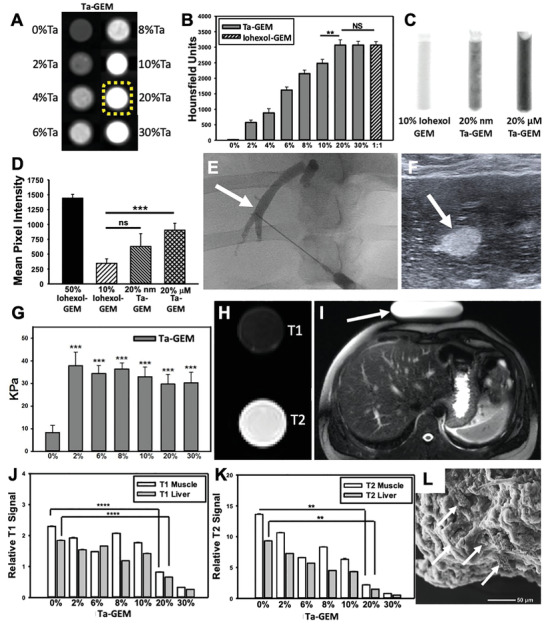
Assessing GEM visibility with multiple imaging modalities. A) CT axial images of eight syringes loaded with 0–30%Ta‐GEM inside a phantom simulating the human chest are shown; B) 20%Ta GEM (yellow dashed outline) demonstrates similar Hounsfield units when compared to 30% Ta‐GEM or 50% iohexol‐GEM (n = 4). C,D) Fluoroscopic images of syringes loaded with GEM containing 10% iohexol, 20% Ta nanoparticles (Nano‐Ta), or 20% Ta microparticles (Micro‐Ta); D) quantitation of the mean pixel intensity on fluoroscopy images show 20% micro‐Ta produce sufficient intensity (n = 4); 50% iohexol is included as a comparison because it is a concentration used clinically. E,F) Ultrasound and fluoroscopic images of the same area (arrow) during percutaneous hepatic vein embolization in a pig using 20% Ta‐GEM. G) Graphic summary of shear wave elastography of GEM containing 0–30% Ta microparticles (n = 3). H) Transverse view of standard T1 and T2 MRI of syringe filled with 20% Ta‐GEM showing attenuation for T1‐sequence and bright signal for T2‐sequence. I) T1 and T2 signal intensity of muscle and liver was calculated relative to an MRI phantom (arrow). J,K) The T1 and T2 signal of 20% Ta GEM relative to the signal calculated in (I) is depicted in the graphs; these indicate that the signal intensity of Ta‐GEM is greater than muscle or liver suggesting that it will be visible by MRI. L) Scanning electron microscopy of 20%Ta‐GEM (white arrows, Ta microparticles). Data are mean ± SD (**p < 0.01, ***p < 0.001, ****p < 0.0001).
