
Figure 6.
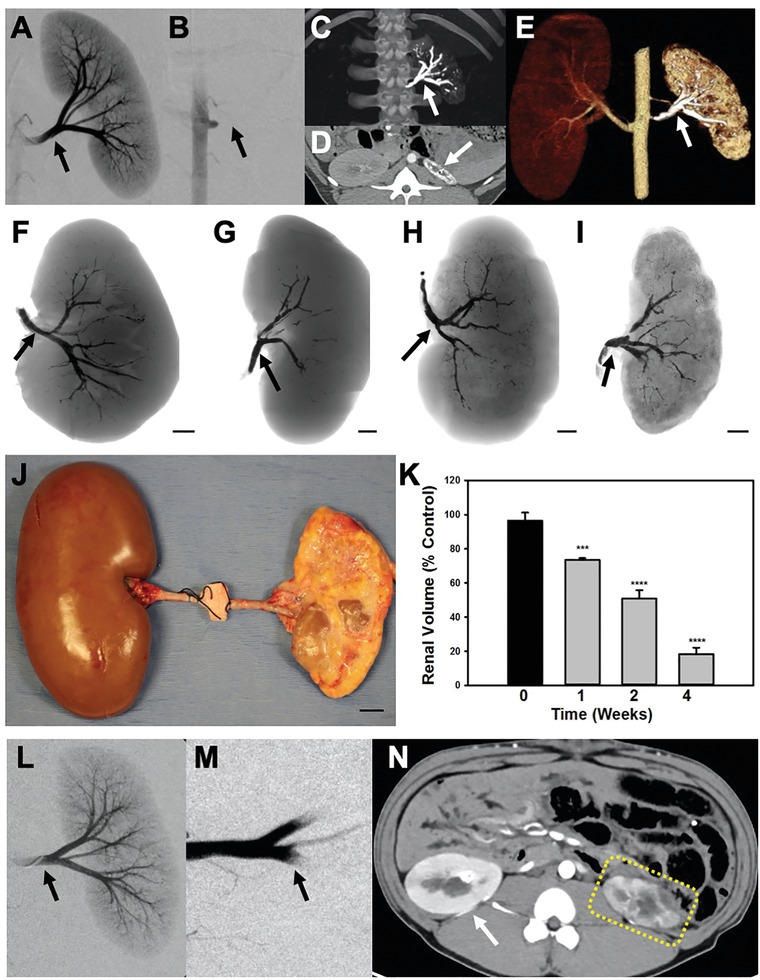
Embolization of the swine renal artery using Ta‐GEM and comparison to gelfoam. A,B) Fluoroscopic images before and after renal artery embolization with Ta‐GEM; following injection of 2–3 cc of Ta‐GEM, there is complete absence of renal arterial flow to the kidney (arrow). C) The maximum intensity projection image shows the left main renal artery and segmental branches occluded with Ta‐GEM (arrow). D) Axial CT and E) 3D reconstructed image shows the markedly atrophic kidney with Ta‐GEM in renal artery. F–I) Representative coronal images of the embolized kidneys with Ta‐GEM at 0, 1, 2, or 4 weeks, respectively. The cortex of the kidney is devoid of Ta‐GEM. J) Photograph showing the gross appearance of the embolized kidney at four weeks following necropsy with compensatory hypertrophy of the contralateral kidney. K) Summary of total kidney volume measurements following renal artery embolization (***p < 0.001, ****p < 0.0001 using one‐way analysis of variance, n = 4 in each group). L,M) DSA image before and after embolization of renal artery using gelfoam (black arrow). N) At two weeks postembolization, axial CT image shows enhancement of the embolized kidney and blood flow in the arteries despite successful renal artery embolization (dashed yellow outline). Overtime there is progressive atrophy of the kidney. Data reported as the mean ± SEM.