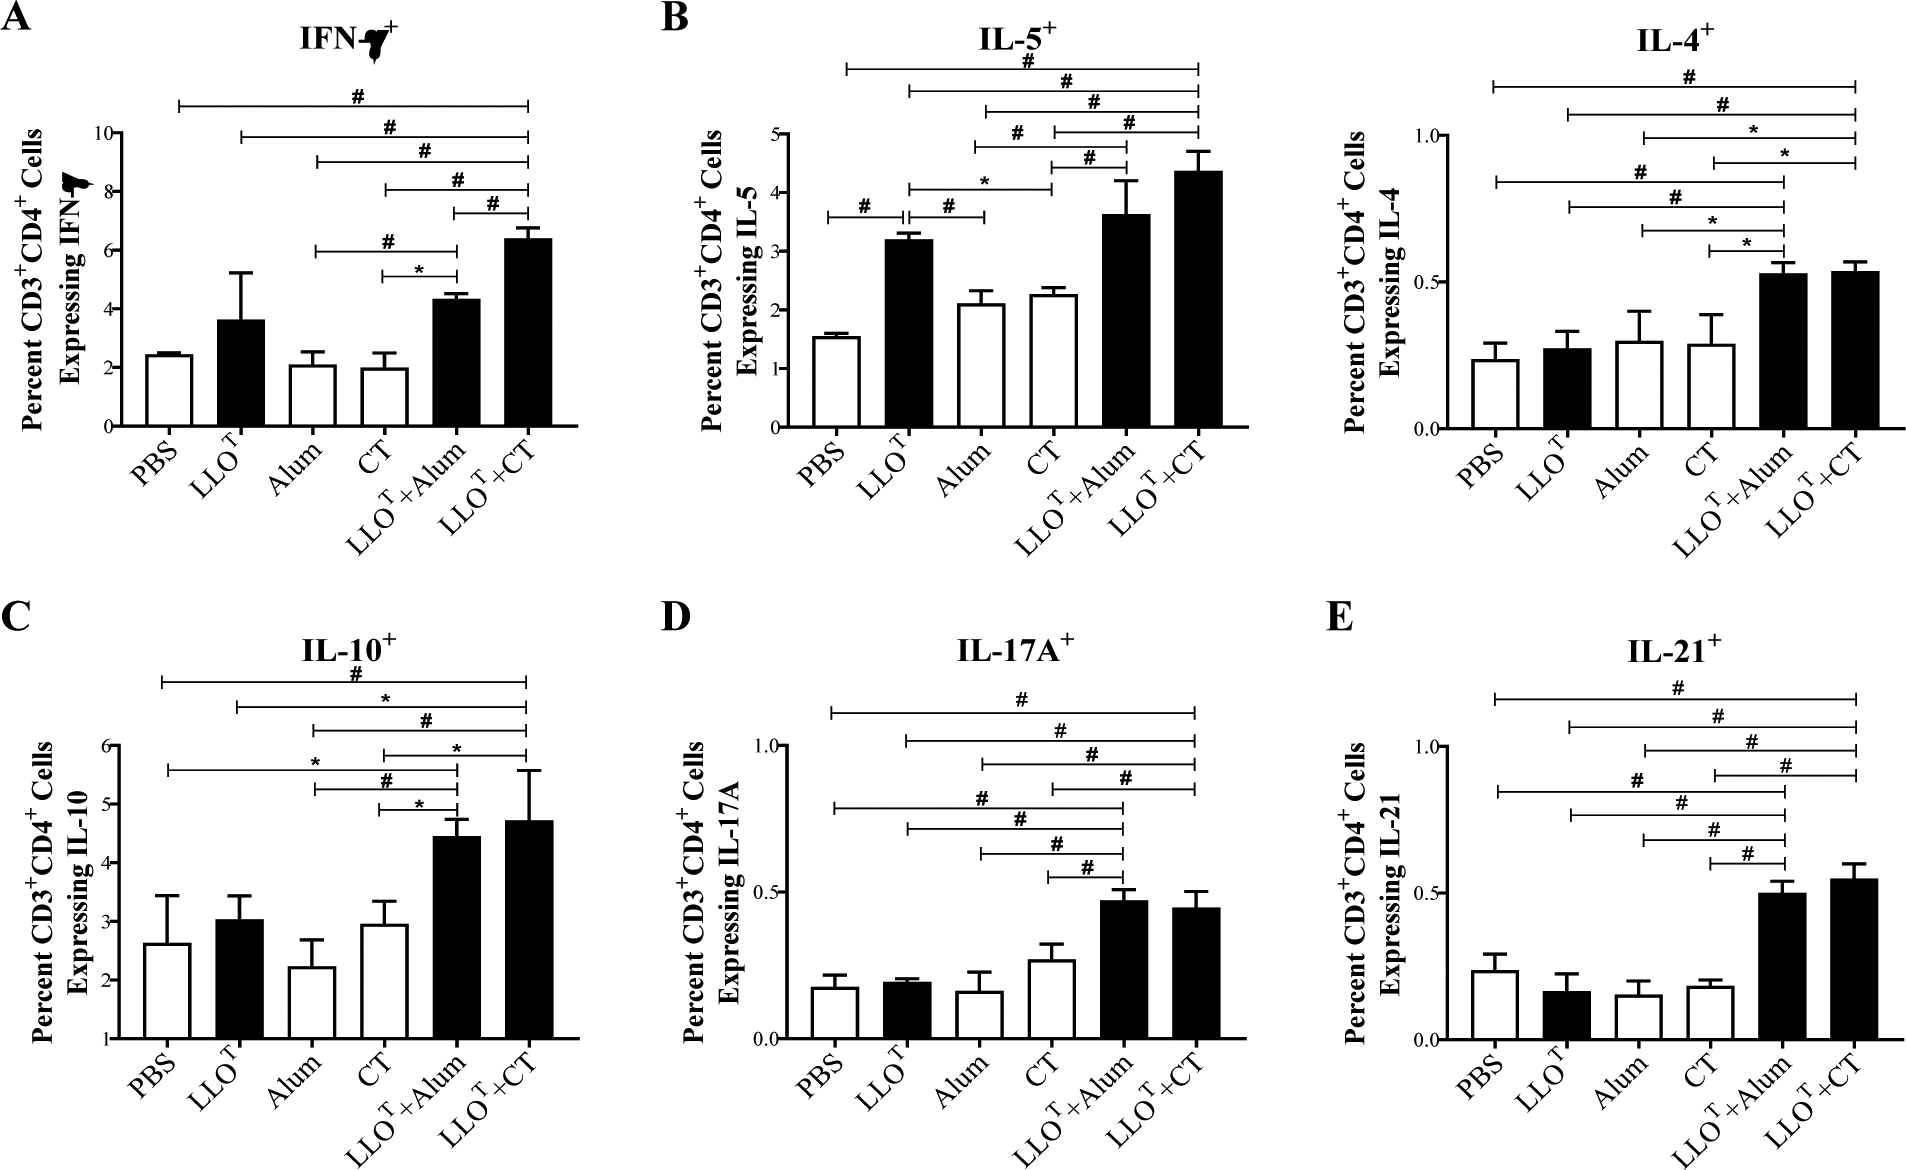
Figure 9. Analysis of T cell responses in the different immunized groups.

Splenocytes from the different immunized groups were isolated at day 38 after initial immunization and cultured 5 days in the presence of 5 μg/ml LLOT. Cultured splenocytes were then stimulated with PMA and ionomycin for 1 h and subsequently treated with Golgistop for 5 h. Splenocytes were then labeled with fluorescently tagged antibodies against CD3, CD4, IFN-γ, IL-5, IL-4, IL-10, IL-17a, and IL-21 and analyzed by flow cytometry. The frequencies of LLOT-specific Th1 (CD3+CD4+IFN-γ+) (A); Th2 (CD3+CD4+IL-5+, CD3+CD4+IL-4+, and CD3+CD4+IL-10+) (B and C); Th17 (CD3+CD4+IL-17A+) (D); and Tfh (CD3+CD4+IL-21+) (E) were expressed as the average percentage of positive cells for indicated cytokines ± standard deviation among the CD3/CD4 double positive cells. Statistical differences were determined by one-way ANOVA and significant differences were considered at: * p ≤ 0.05 and # p ≤ 0.005.
