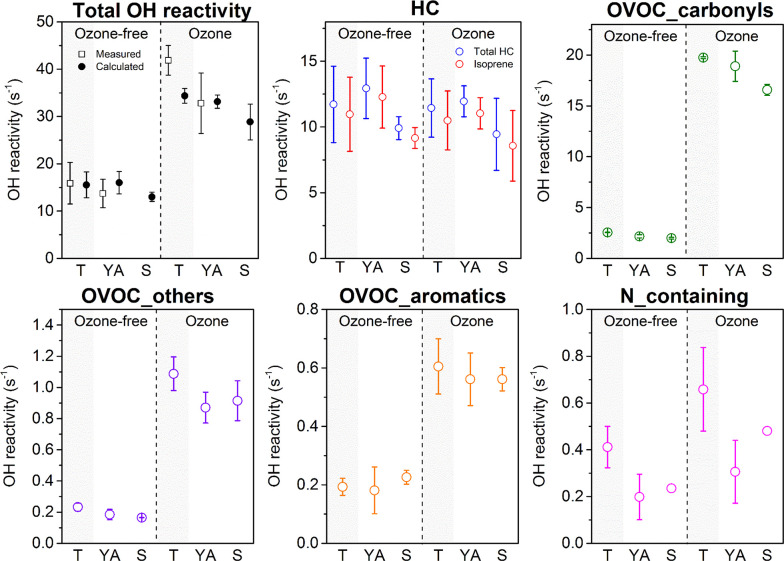
Figure 3.
Total calculated and measured OH reactivity and the calculated OH reactivity for five chemical subgroups (those making the greatest contributions) for whole-body emissions from teenagers (T, n = 2), young adults (YA, n = 4), and seniors (S, n = 2). Error bars refer to the standard deviations obtained from benchmark experiments in each age group. Since nitrogen containing species were dominated by ammonia (due to its high mixing ratios49) and the data were only available for one benchmark experiment, the variation (error bars) for the senior group (Experiment 25) could not be derived.

