Figure 3.

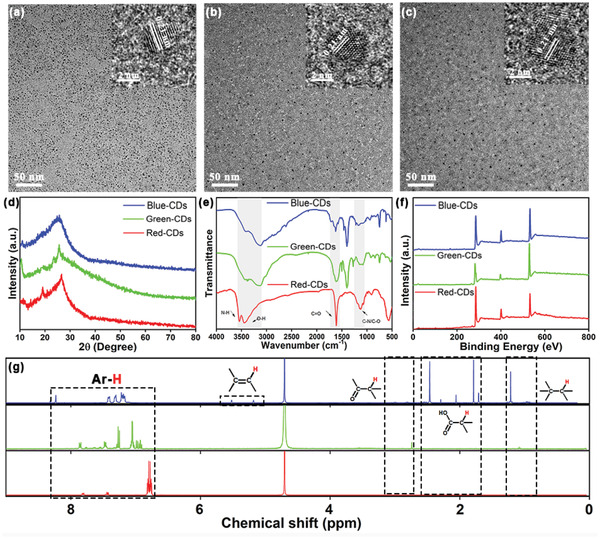
TEM and HRTEM images (inset) of a) B‐CDs, b) G‐CDs, and c) R‐CDs; d) XRD pattern; e) FTIR spectra; f) XPS spectra and g) 1H NMR spectrum of the three selected CDs.

TEM and HRTEM images (inset) of a) B‐CDs, b) G‐CDs, and c) R‐CDs; d) XRD pattern; e) FTIR spectra; f) XPS spectra and g) 1H NMR spectrum of the three selected CDs.