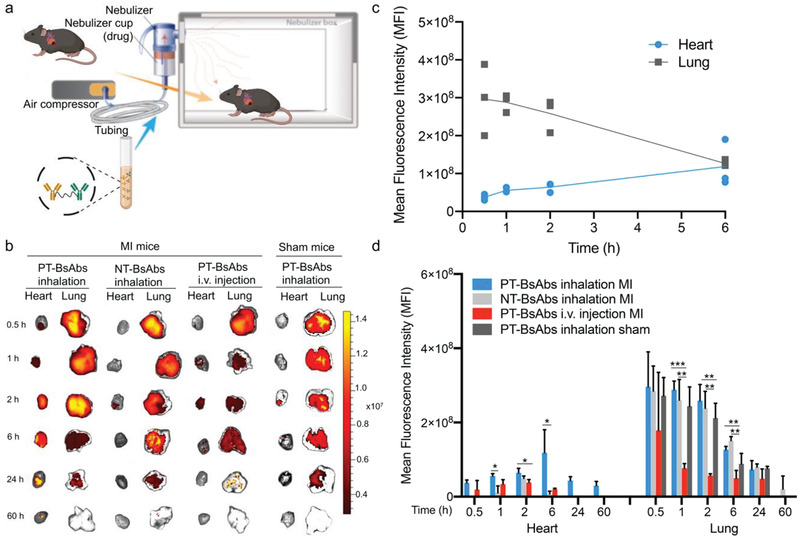
Figure 2.

Biodistribution of inhaled PT‐BsAbs assessed by fluorescent imaging. a) Schematic showing the inhalation system. b) Ex vivo imaging to evaluate the distribution of PT‐BsAbs or NT‐BsAb after inhalation, PT‐BsAbs after i.v. injection in MI mice, and PT‐BsAbs after inhalation in sham mice at different time points. c) Time‐course quantification of fluorescence signals from heart and lung tissue of MI mice treated with PT‐BsAbs via inhalation. d) Time‐course quantification of fluorescence signals from the heart and lung of the mice. N = 3.
