Figure 3.

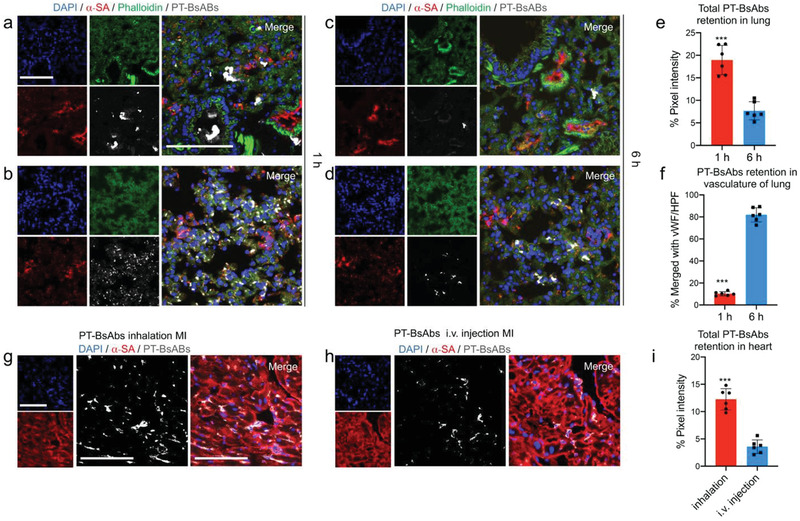
Biodistribution of inhaled PT‐BsAbs assessed by histology. a–d) Representative confocal images showing distribution of PT‐BsAbs in the bronchi and parenchyma of MI mice, respectively, a,b) 1 h and c,d) 6 h after inhalation. PT‐BsAbs were pre‐labeled with DyLight 633 (gray). Lung cells were stained with AF 594‐labeled Phalloidin antibody (green), lung vasculature was stained by von Willebrand Factor (vWF) antibody (red); nuclei were stained with DAPI (blue). Scale bar, 100 µm. e) Quantification of PT‐BsAbs in MI mice in the lung 1 h and 6 h after inhalation, respectively. f) Time‐course quantification results of PT‐BsAbs in MI mice in vasculature of lung 1 h and 6 h after inhalation, respectively. Confocal imaging revealing the PT‐BsAbs retention in the border zone of MI heart 6 h after g) inhalation or h) i.v. injection. Cardiomyocytes were stained with alpha sarcomeric actin (α‐SA) (red). Nuclei were stained with DAPI (blue). Scale bar, 100 µm. i) Quantification results of PT‐BsAbs in the MI heart 6 h after inhalation or i.v. injection. N = 6.
