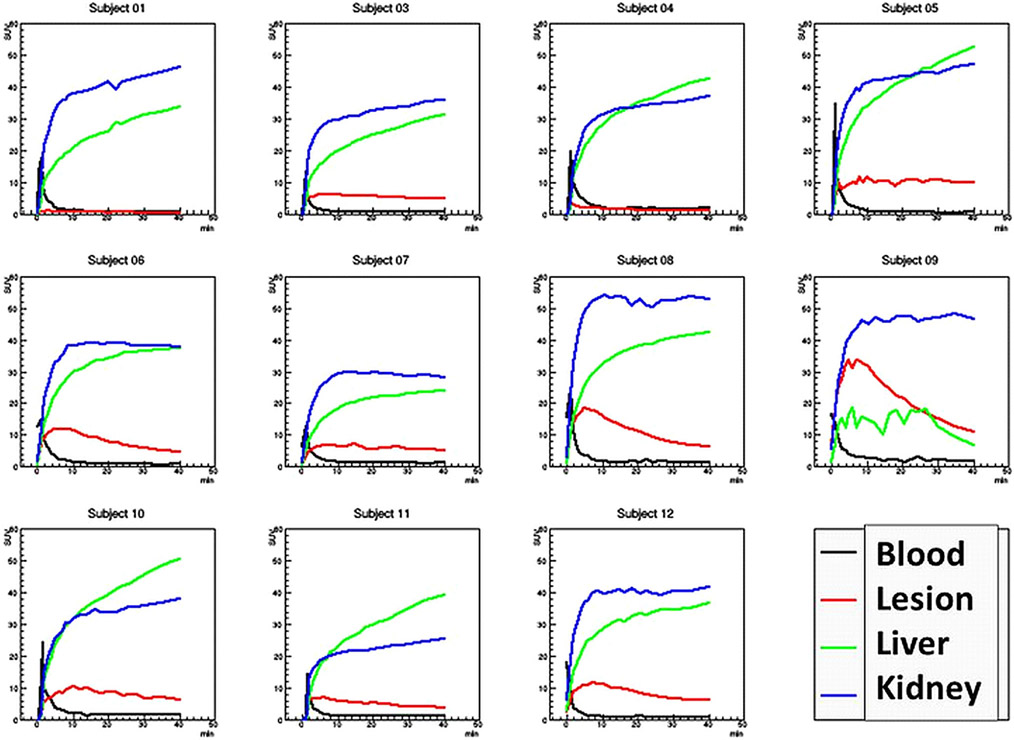
Fig. 4.
Time-activity curves (TAC) for the 11 subjects. Note, subject 9 only had a few voxels of liver activity and thus the liver TAC is not well sampled. Visual inspection shows the tumor lesion demonstrating reversible binding of the ligand, while the kidney and liver tissue do not. Also note subject #1 had a benign lesion with no uptake.

