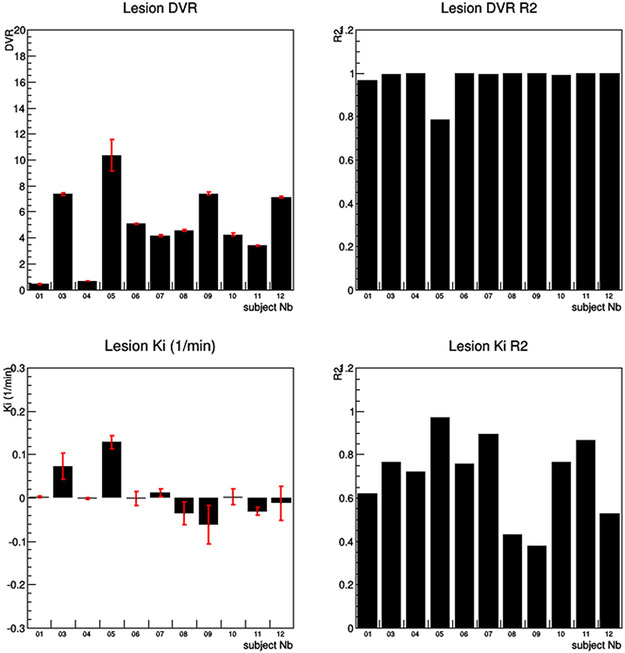
Fig. 6.
The results of both the Logan and Patlak graphical analysis. The Logan graphical analysis showed a strong linear fit for all subjects except subject #5 with an R2 greater than .95. In contrast, the Patlak graphical analysis shows very poor linear fits with R2 fit values much less than .9, thus demonstrating that the ligand shows reversible binding.

