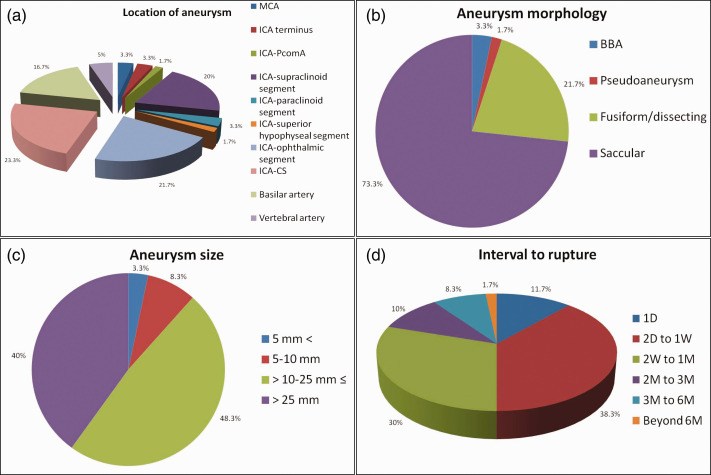
Figure 2.
Statistical diagrams of the ruptured aneurysms after flow diversion.
(a) Intracranial location of the delayed ruptured aneurysms. (b) Morphology of the delayed ruptured aneurysms. (c) Maximal size of the delayed ruptured aneurysms. (d) The interval from successful deployment of flow diverter to delayed aneurysmal rupture.
CS: cavernous sinus; ICA: internal carotid artery; MCA: middle cerebral artery; PcomA: posterior communicating artery; BBA: blood blister aneurysm; D: day; M: month; W: week

