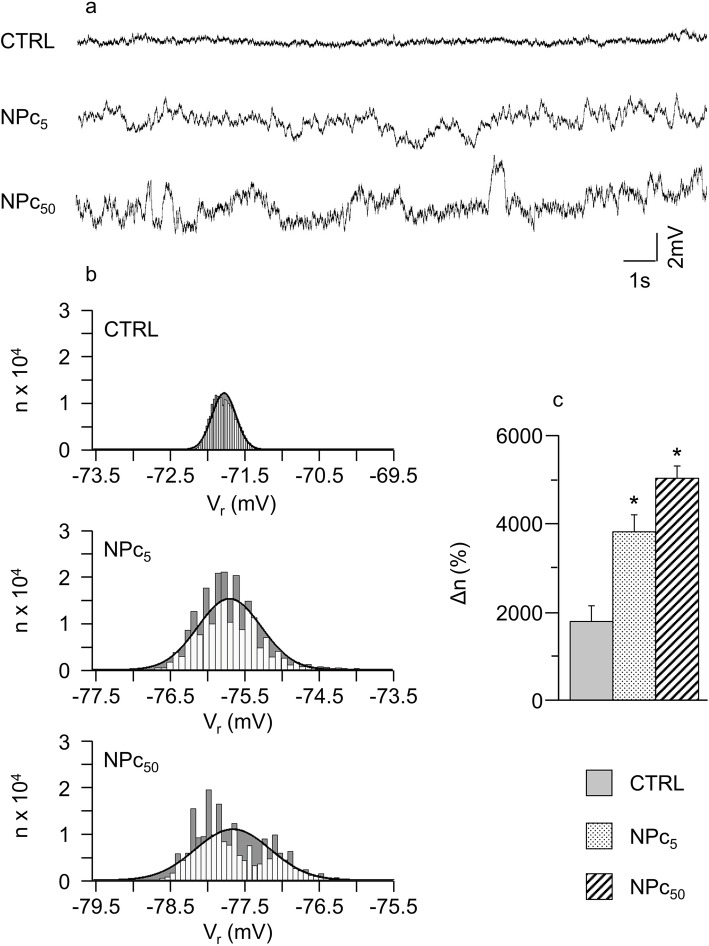
Fig. 1.
Variability of resting membrane potential following exposure to Co3O4-NPs. a) Representative 20 s Vr time courses recorded in un-stimulated patch clamped cells belonging to the three experimental groups, previously conditionally paced at 5 Hz for 8 s; b) frequency distributions of Vr (50 sub-intervals of the entire Vr range) with superimposed normal fitting (solid lines). The difference between the number of samples for each interval and that expected from the normal fitting (Δn) is marked in grey; c) mean values ± SEM of Δn, in CTRL, NPc5, and NPc50 groups. *, p< 0.05 vs CTRL (Kruskal-Wallis non-parametric statistical test followed by U-Mann Whitney test)

