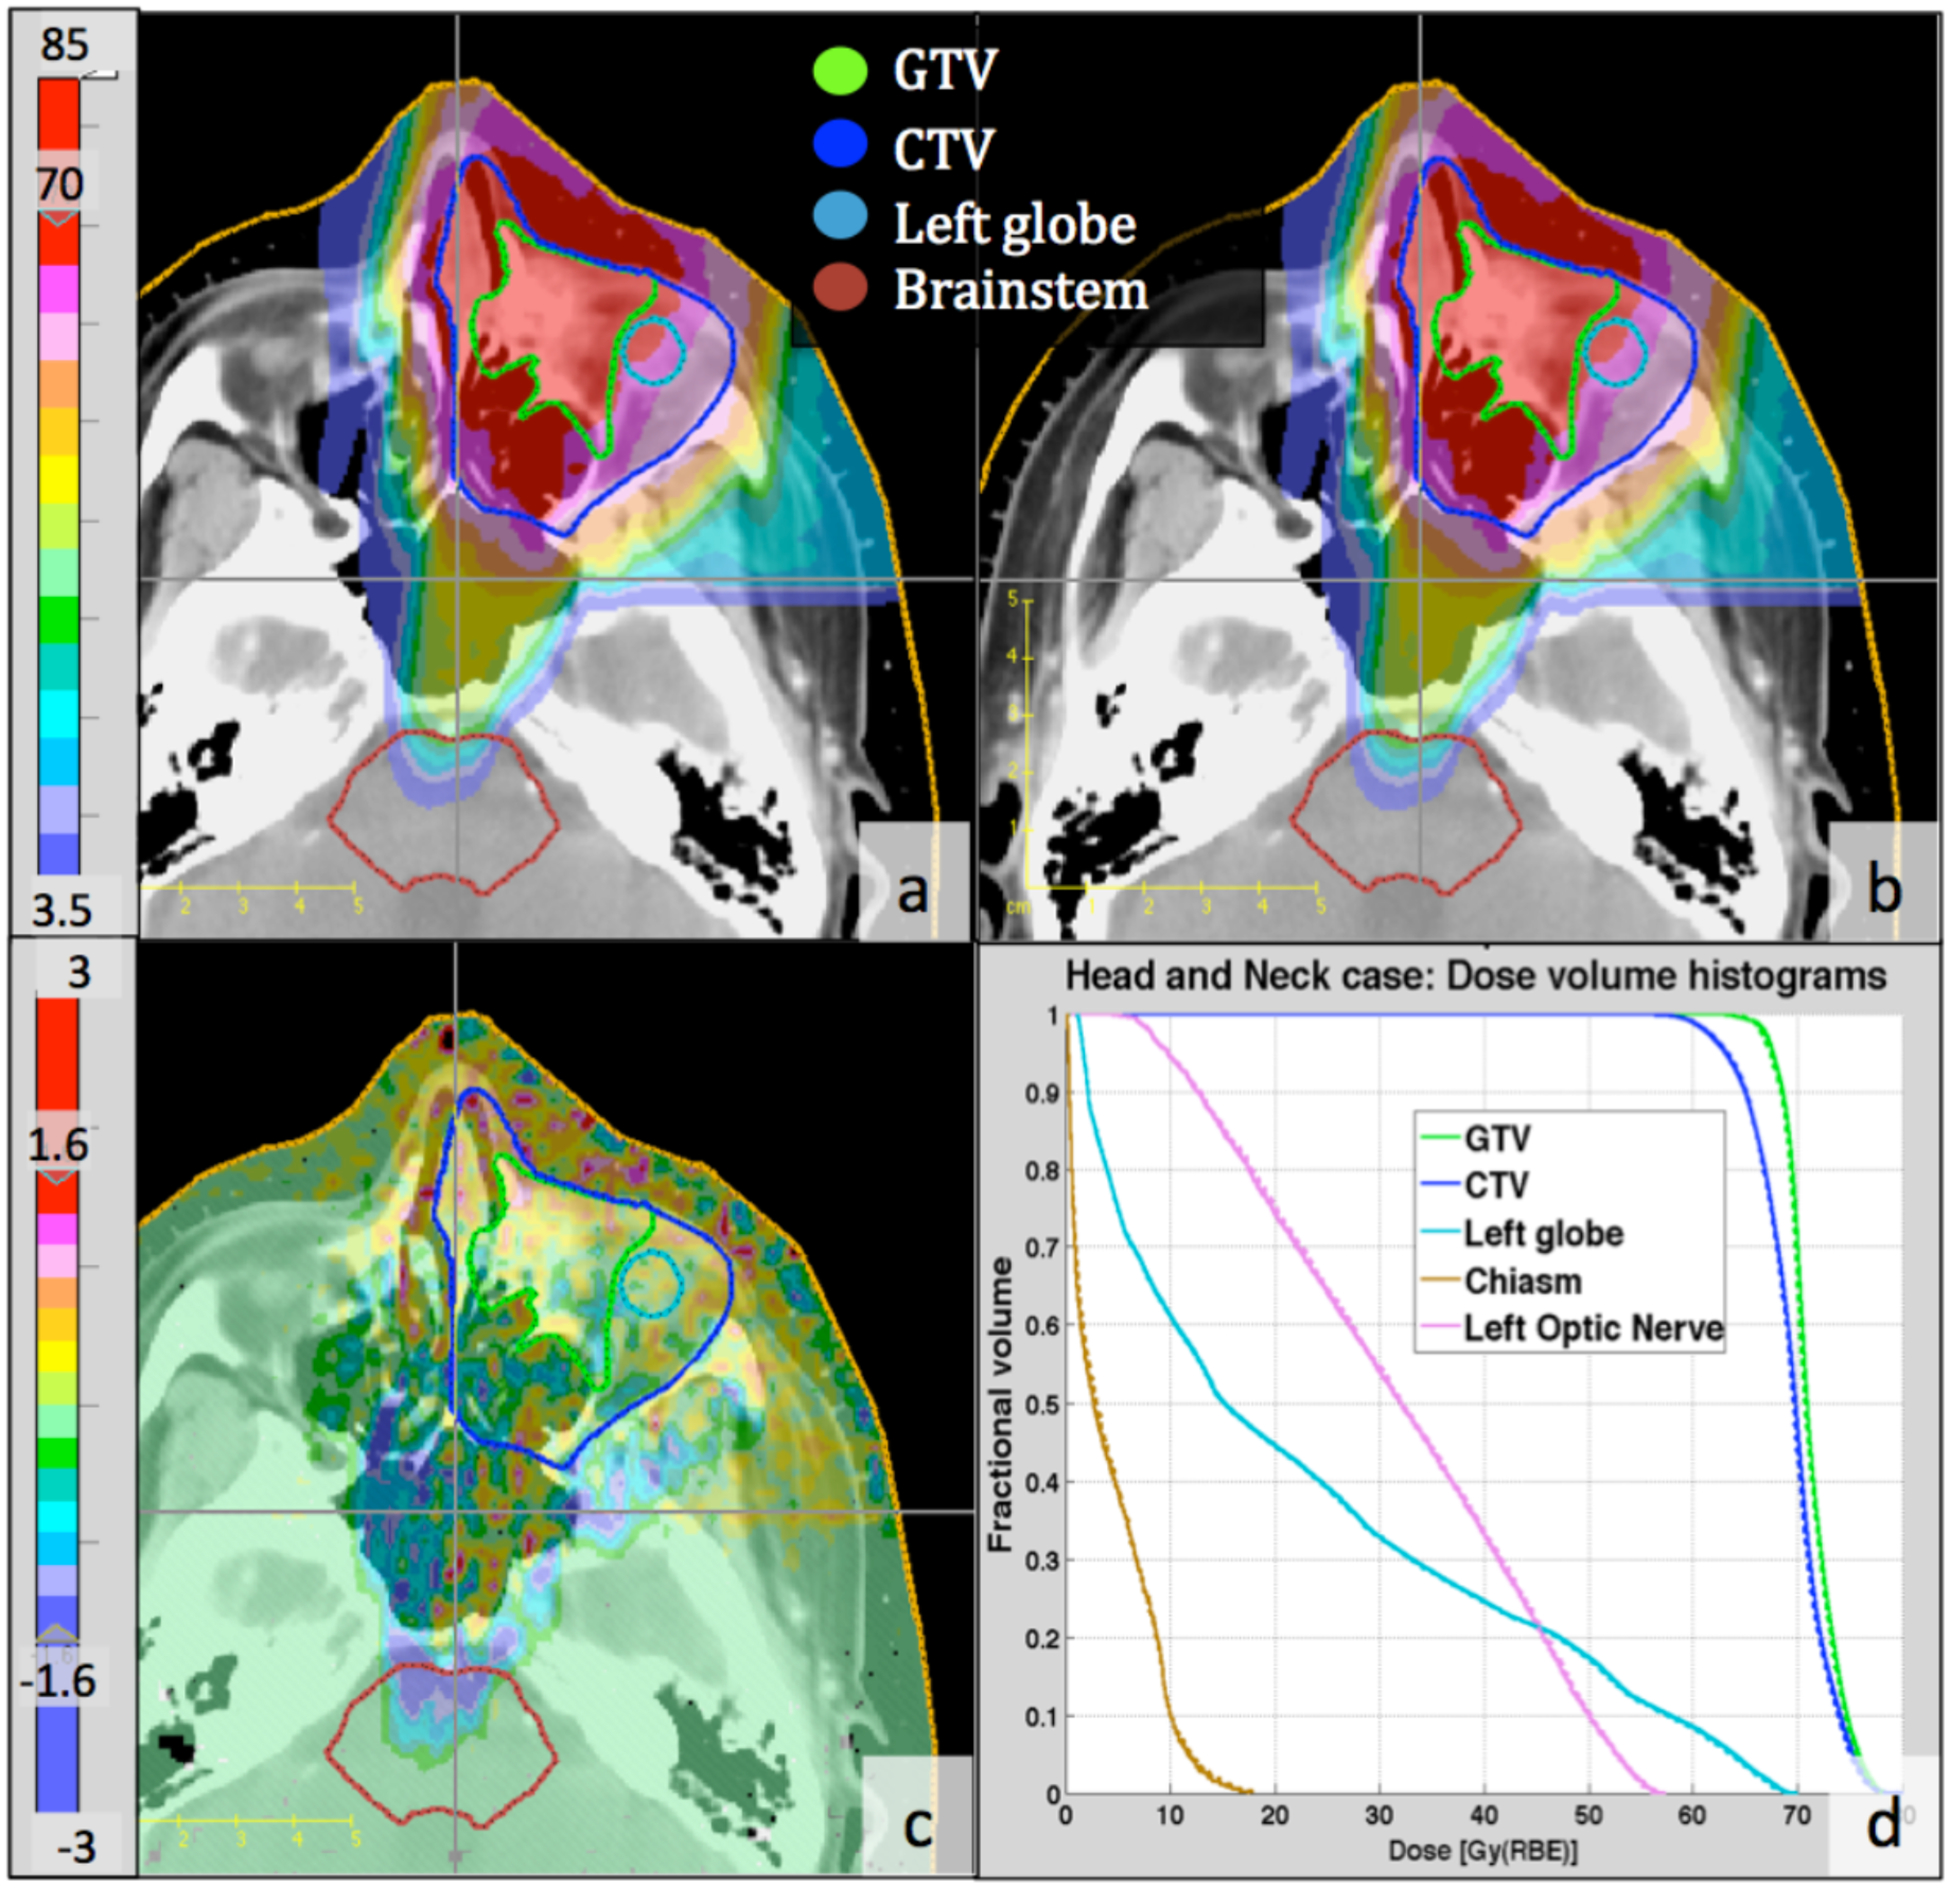
Figure 1:

Two-dimensional and DVH comparison between gPMC and TOPAS calculated doses for a head- and-neck case, (a): gPMC-calculated dose distribution; (b): TOPAS-calculated dose distribution; (c): Absolute dose difference (gPMC - TOPAS); (d): DVHs for targets and OARs; Solid lines: gPMC; Dashed lines: TOPAS. Colorbars on the left are in units of Gy(RBE).
