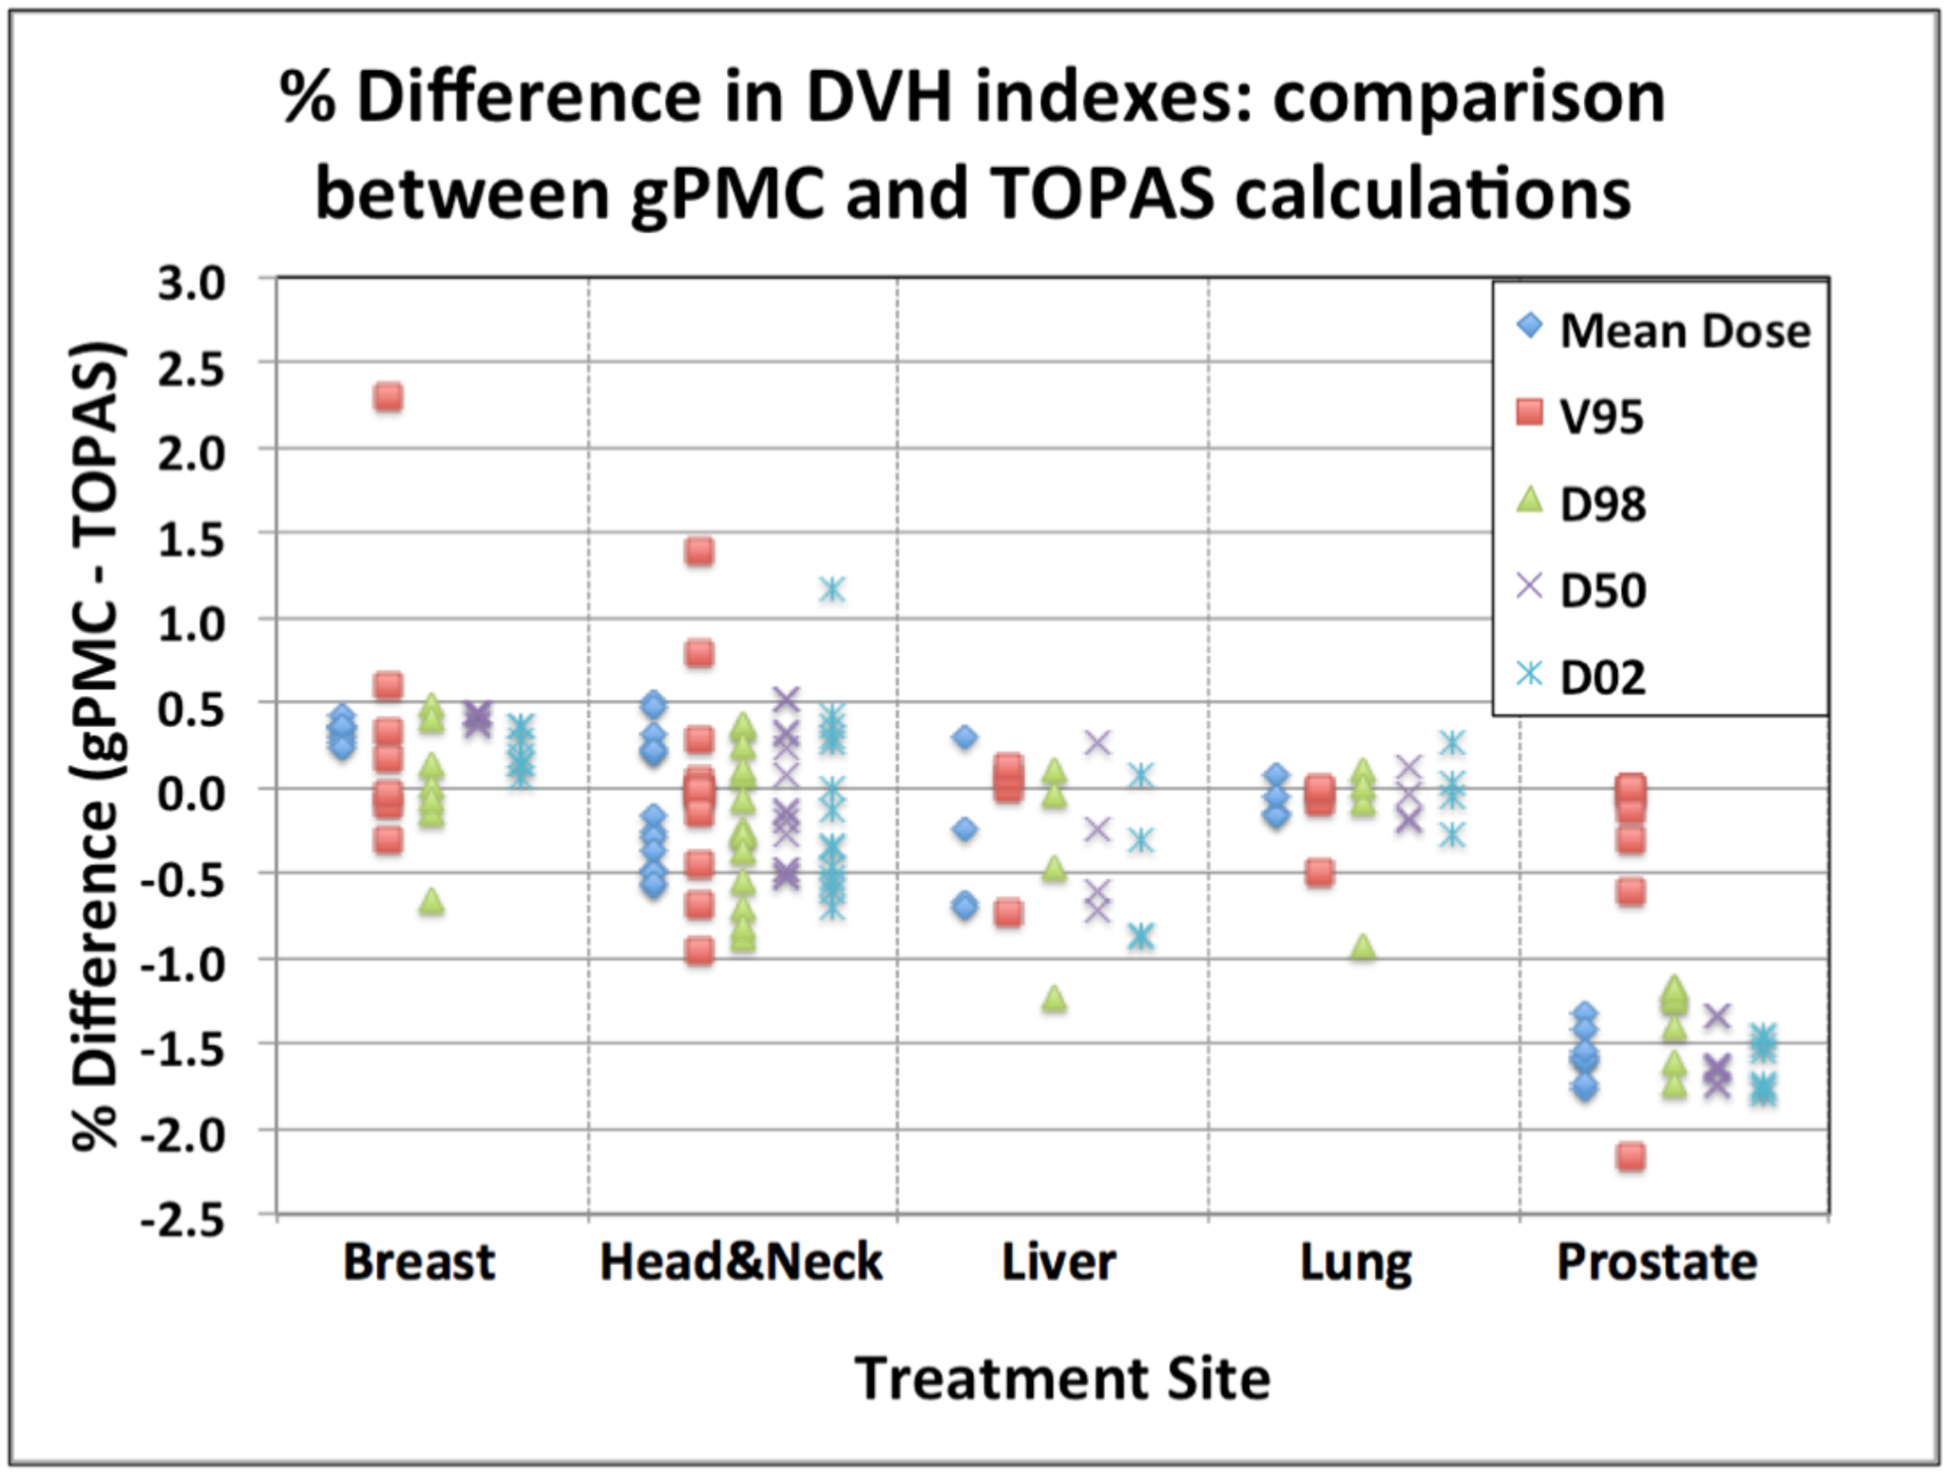
Figure 2:

Percent discrepancies of dosimetric evaluators for the target volumes: comparison between gPMC and TOPAS calculations. Data for all patients are displayed, grouped per treatment site. Each point corresponds to the difference in the dosimetric represented by the symbol for the target volume of a patient belonging to the treatment site given at the bottom of the graph section.
