Fig. 1.
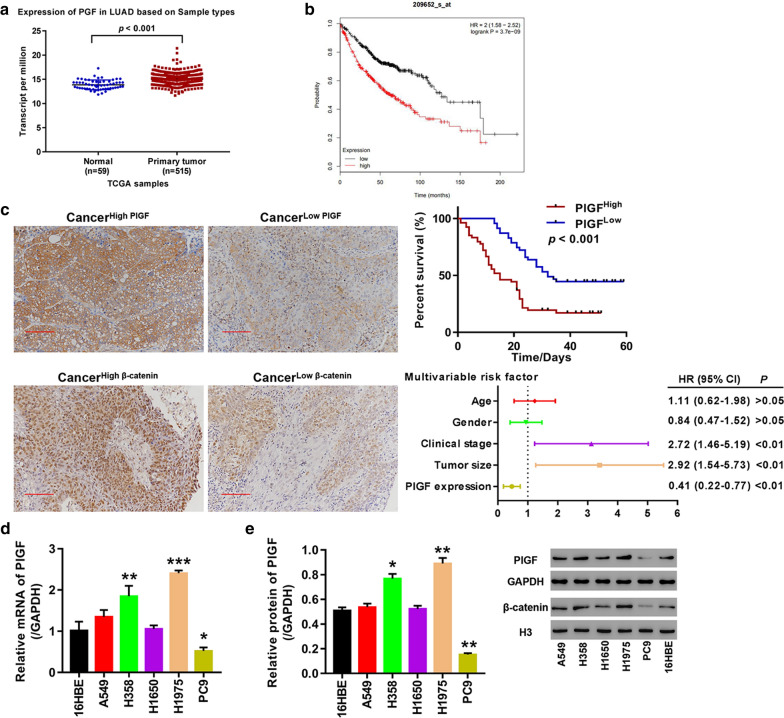
PlGF was highly expressed in lung adenocarcinoma tissue and cells. a Comparison of PlGF expression in normal and tumor tissues based on TCGA data; b Survival analysis of the patients with high and low PlGF expression; c Analysis of PlGF expression in cancer tissue microarrays. Left panel shows representative IHC images of PlGF and β-catenin staining in cancer and paracancer tissue microarrays (200 × magnification); upper panel shows Kaplan–Meier survival curves of the cancer tissue samples with high and low PlGF expression; lower panel displays results of multi-variable cox regression analysis; d PlGF mRNA levels in A549, H1975, H1650, H358, PC9and 16HBE cells; e PlGF protein expression in A549, H1975, H1650, H358, PC9 and 16HBE cells. *p < 0.05, **p < 0.01, ***p < 0.001 vs.16HBE cells

