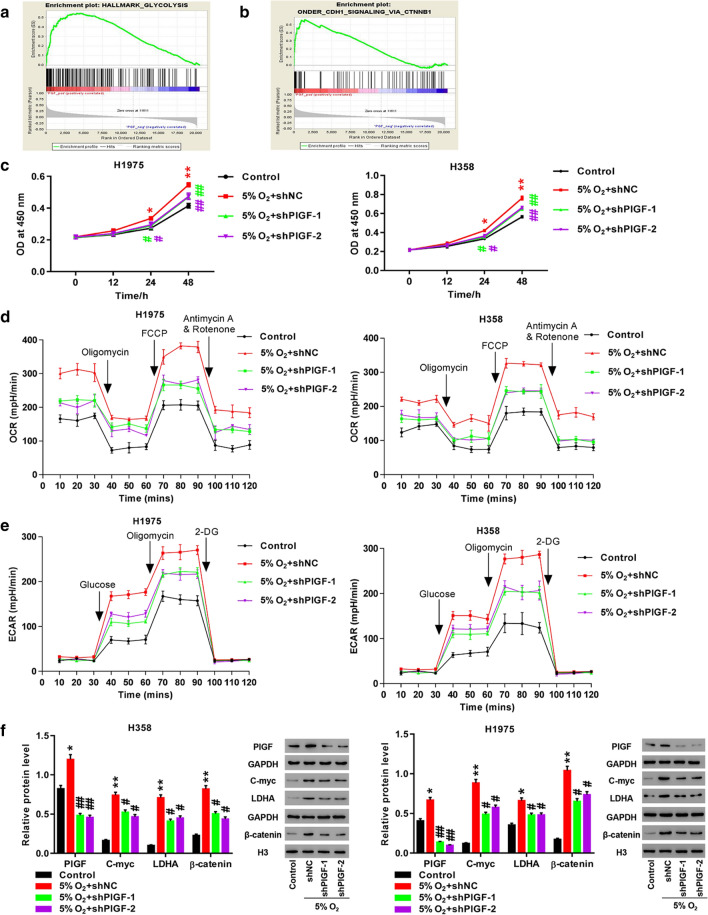
Fig. 4.
Knockdown of PlGF potently reversed hypoxia-induced proliferation and glycolysis. a, b Enrichment results of glycolysis (a) and β-catenin (b); c Measurement of cell proliferation by CCK-8 assay; d Evaluation of OCR level by cell mito stress test assay; e Evaluation of ECAR level by glycolysis stress test assay; f Detection of PlGF, C-myc, LDHA, and β-catenin by Western blot. H1975 and H358 cells are infected with shNC, shPlGF-1 or shPlGF-2, followed by exposure to hypoxic condition for 24 h. *p < 0.05, **p < 0.01 vs. Control; #p < 0.05, ##p < 0.01 vs. 5% O2 + shNC

