Fig. 4.
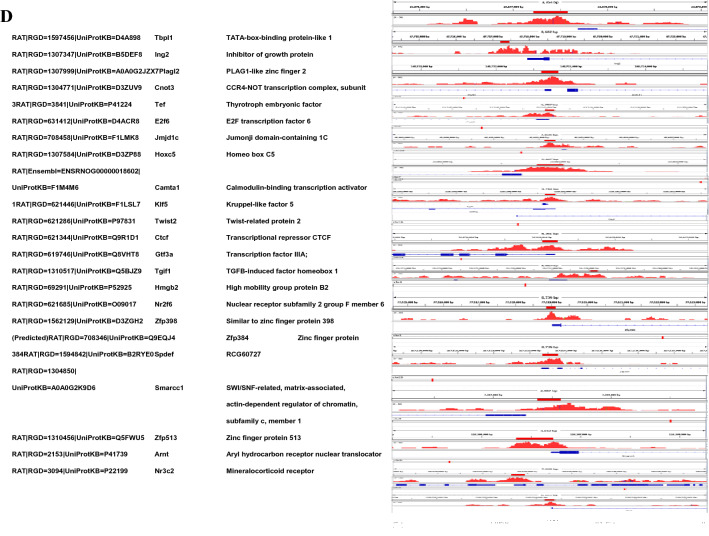
Functional analysis of H1T2 bound promoter-TSS regions in rat spermatids genome. a Gene ontology analysis of the 321 genes whose promoter-TSS regions are bound to H1T2. David software was used for the analysis and the results are shown in the figure. GO biological processes are represented in the figure with P values. X-axis represents the number of genes associated to the GO term. b Distribution of H1T2 peaks from ± 3 kb centered around TSS of genes in the spermatids genome and heatmap showing the same observation ngs. Plot showing distribution of H1T2 peaks throughout the gene. c GO analysis of 321 genes according to molecular function represented as pie diagram. The number of genes associated to the GO term is given in the pie chart. 23 transcription factors whose promoter-TSS is bound to H1T2 are highlighted in the pie diagram. d Integrative Genomics Viewer (IGV) outputs of representative genomic regions showing the occupancy of H1T2 at various transcription factors of the spermatid genome


