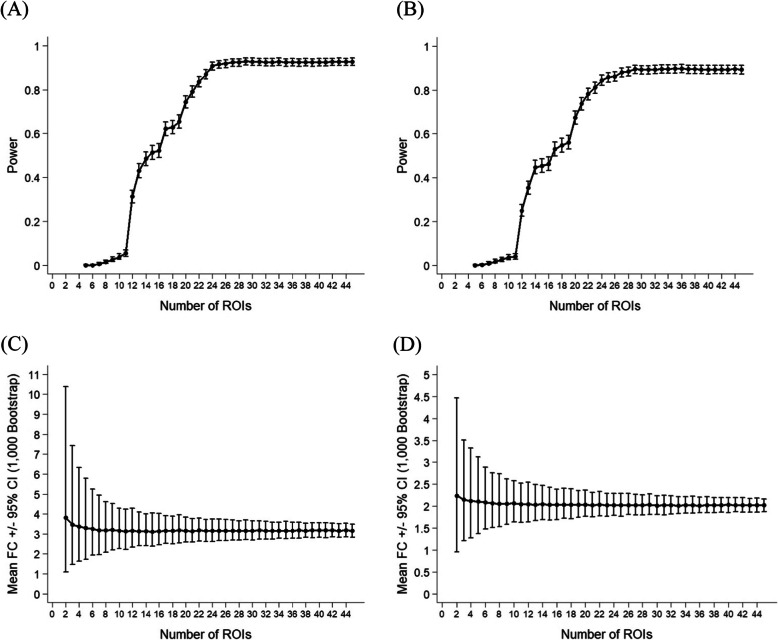
Fig. 4.
Power analyses illustrating the effects of ROI sample size. a, b Power curve according to ROI size, holding patient sample size (n = 15) fixed, for the PD-L1 mIF biomarker (a) and the sTIL mIF biomarker (b) produced using a Monte Carlo simulation approach (n = 1000 simulations), based on the generalized linear mixed effects model and the observed data structure [i.e., effect sizes and variations obtained post hoc from the pilot experiment]. c, d Mean fold change and 95% confidence intervals based upon a bootstrap simulation method (1000 simulations) according to ROI size, for the PD-L1 mIF biomarker (c) and the sTIL mIF biomarker (d). ROI: region of interest; FC: fold change; CI: confidence interval

