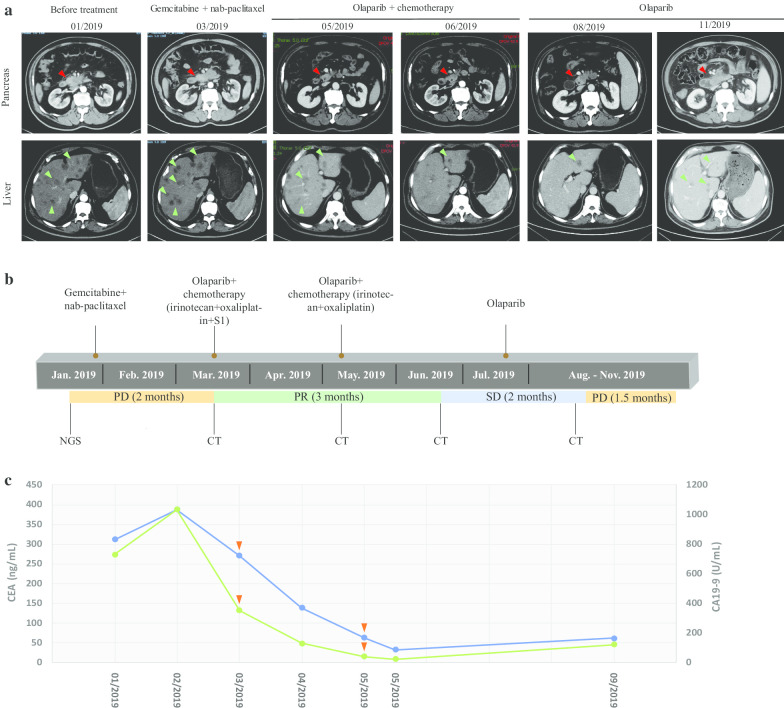
Fig. 1.
CT images and measurements of serum tumor biomarkers during the course of treatment. a Serial CT scans demonstrated a reduction in the size of the pancreatic (red arrows) and metastatic hepatic lesions (green arrows) following olaparib therapy. b A timeline indicating the application of different therapeutic strategies and the patient’s response. c Measurements of serum CEA and CA19-9 levels at different treatment times. Blue line: CEA; green line: CA19-9; orange arrows: time points of the CT scans. PD progressive disease, PR partial response, SD stable disease

