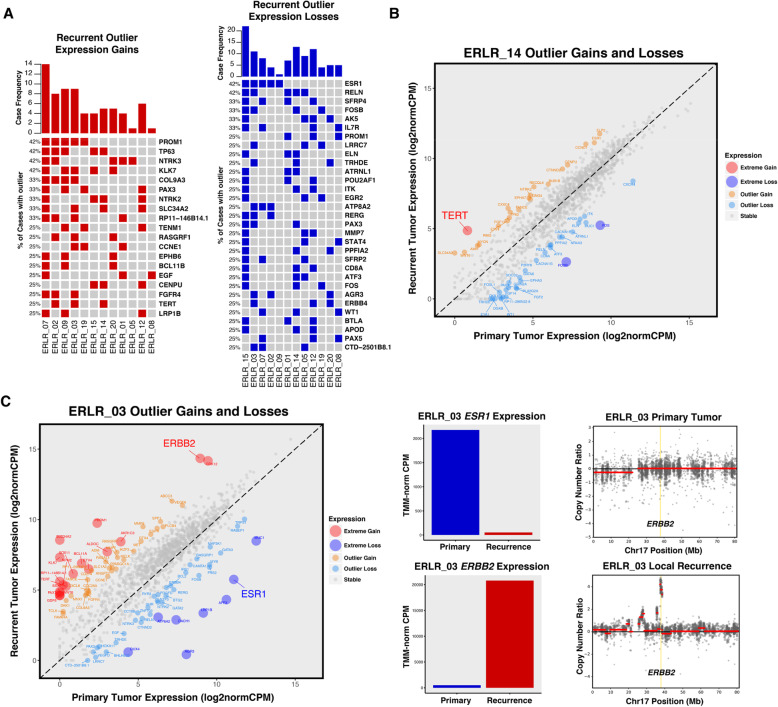
Fig. 3.
Outlier expression gains and losses in ER-positive local recurrences. a OncoPrint of outlier expression gains (red) and outlier expression losses (blue) in ER-positive local recurrences. Genes are sorted by frequency of outlier changes across pairs. b Extreme expression gain of TERT in case ERLR_14; 2 other cases showed similar TERT enrichments in recurrent tumors. c Extreme expression gain and loss of ERBB2 and ESR1, respectively. TMM-normalized CPM values of primary (blue) and recurrent (red) tumor. ERBB2 expression gain is driven by recurrence-specific DNA-level amplification of ERBB2 locus

