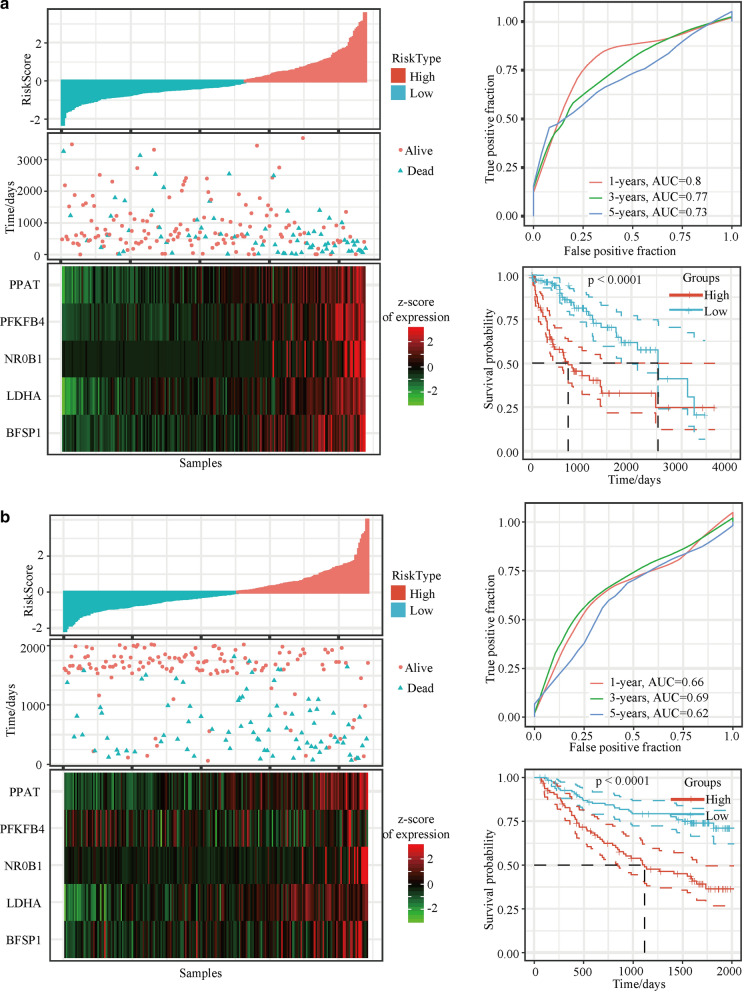
Fig. 2.
Output profiles from the analyses of the TCGA and GSE dataset based on the prognostic model. Risk score (top left), patient status (top right), mRNA expression heatmap (bottom left), and time-dependent ROC and Kaplan–Meier curves (bottom right) of the five-gene-based model for the a. TCGA-LIHC training set and b. GSE14520 dataset. TCGA The Cancer Genome Atlas, ROC receiver operating characteristic, PPAT phosphoribosyl pyrophosphate amidotransferase, BFSP1 beaded filament structural protein 1, LDHA lactate dehydrogenase A, NR0B1 nuclear receptor subfamily 0 group B member 1, PFKFB4 6-phosphofructo- 2-kinase/fructose-2,6-bisphosphatase 4

