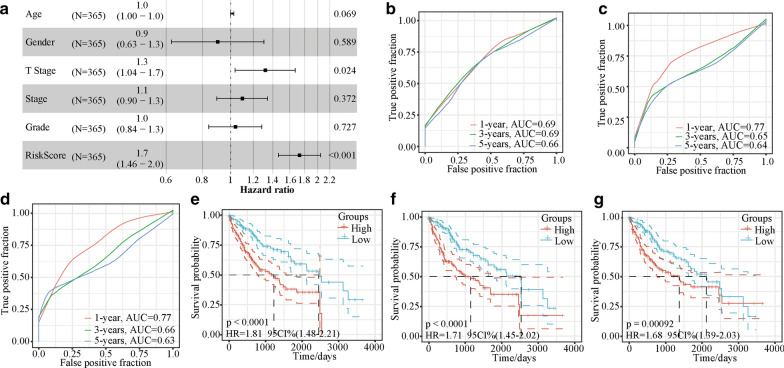
Fig. 6.
The forest plot and comparison of the five-gene-based model and other models. a Forrest plot of the clinicopathological parameters age, T stage, stage, grade, and risk score of 365 HCC patients. Time-dependent ROC analysis and Kaplan–Meier analysis for b, e. the five-gene signature, c, f. the HCC prognostic evaluation model, and d, g. the six-gene model. ROC receiver operating characteristic, HCC hepatocellular carcinoma, T tumour, AUC area under the curve, HR hazard ratio, CI confidence interval

