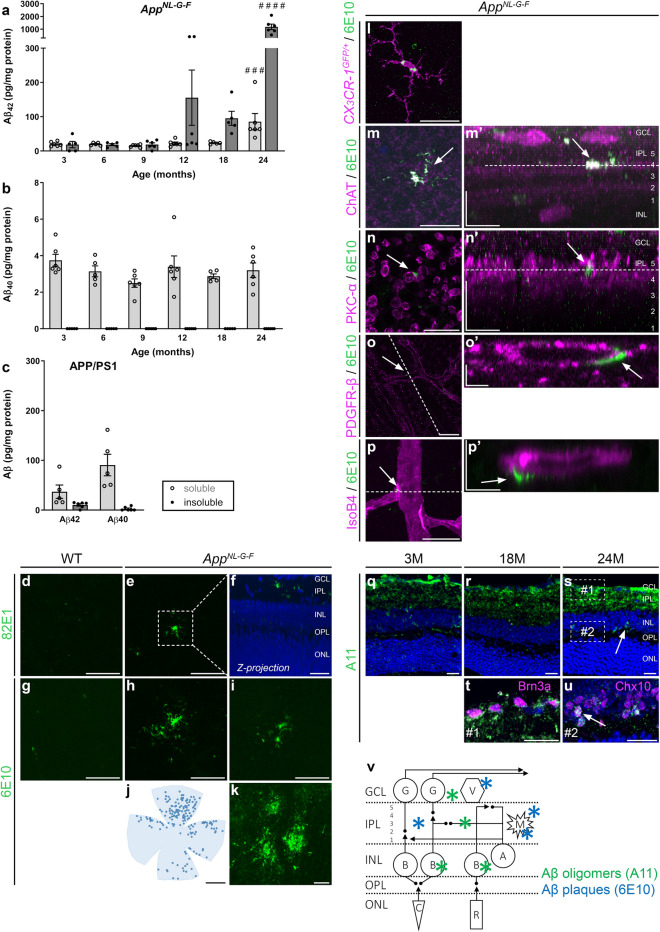
Fig. 1.
Amyloid burden increases with age in the retina of AppNL-G-F mice. a, b Amyloid ELISA on retinal lysates of AppNL-G-F mice shows accumulation of soluble Aβ42 from 3 months of age, which rises up till 24 months. Levels of insoluble Aβ42 only start to rise at 12 months. Accumulation of soluble, but not insoluble, Aβ40 is seen at all ages yet does not progress with age. One-way ANOVA with Dunnett’s multiple comparisons test (F5,28 = 6.686, p = 0.0006 for soluble Aβ42; F5,27 = 20.27, p < 0.0001 for insoluble Aβ42); n = 5–6. c Eighteen-month-old APP/PS1 mice have comparable soluble Aβ42 levels yet lower levels of insoluble Aβ42 and higher soluble Aβ40 than AppNL-G-F mice of the same age. n = 5. Of note, human Aβ levels are undetectable in the retinas of WT mice and therefore these controls are not shown. d–i Aβ immunostainings with antibodies 82E1 (d–f) and 6E10 (g–i) on retinal wholemounts of 18-month-old WT (d, g) and AppNL-G-F mice (e, f, h, i) reveal the presence of Aβ plaques in AppNL-G-F mice only. f Example of a reconstruction of the z-plane of the image in panel e, with 82E1 and DAPI nuclear counterstaining, showing that Aβ plaques mainly localize to the inner plexiform layer. j Representative example of a retinal wholemount on which 6E10-positive Aβ plaques are depicted with dots to illustrate plaque distribution in the retina. k Aβ plaques in the cerebral cortex of an 18-month-old AppNL-G-F mouse. l–p Double labeling for Aβ (6E10) and retinal cell markers on retinal wholemounts of 18-month-old AppNL-G-F mice. Single-tile images of the retinal flatmounts, with corresponding orthogonal projections of the z-stack (‘) are shown. Dotted lines in m’ and n’ indicate the z depth for with the single-tile image is shown. Dotted lines in o and p indicate the orientation of the orthogonal projections shown in o’ and p’. l Double labeling for Aβ and Iba1 shows both extra- and intracellular Aβ deposits in microglia, suggesting that microglia surround and phagocytose plaques. m–n Most plaques are found in the inner plexiform layer, where they align with the ChAT+ strata in which the terminals of the cholinergic amacrine cells are organized (m) and the PKCα+ sublayer in which the terminals of the bipolar cells are organized (n). o–p Plaques are also found in the uppermost layers of the retina, in association with the pericytes (o) and endothelial cells (p) of the retinal blood vessels. q–s Immunostaining for oligomeric amyloid (A11) on retinal cross-sections of 3-month- (3 M) (q), 18-month- (18 M) (r) and 24-month-old (24 M) AppNL-G-F mice (s) shows progressive accumulation of Aβ oligomers. t, u These Aβ oligomers are mostly found in the inner plexiform layer, in association with ganglion cells (Brn3a+) and displaced amacrine cells (Brn3a-) in the ganglion cell layer (t), and inside Chx10+ bipolar cells (u). v Schematic overview of the retina and the locations in which Aβ oligomers and plaques were found. Scalebars: 10 µm (m’–p’), 20 µm (d–i, k, n, q–u), 50 µm (p), 100 µm (l, m, o), 1 mm (j). Data are shown as mean ± SEM. GCL = ganglion cell layer, IPL = inner plexiform layer, INL = inner nuclear layer, OPL = outer plexiform layer, ONL = outer nuclear layer, G = ganglion cell, A = amacrine cell, B = bipolar cell, V = blood vessel, M = microglia, C = cone, R = rod

