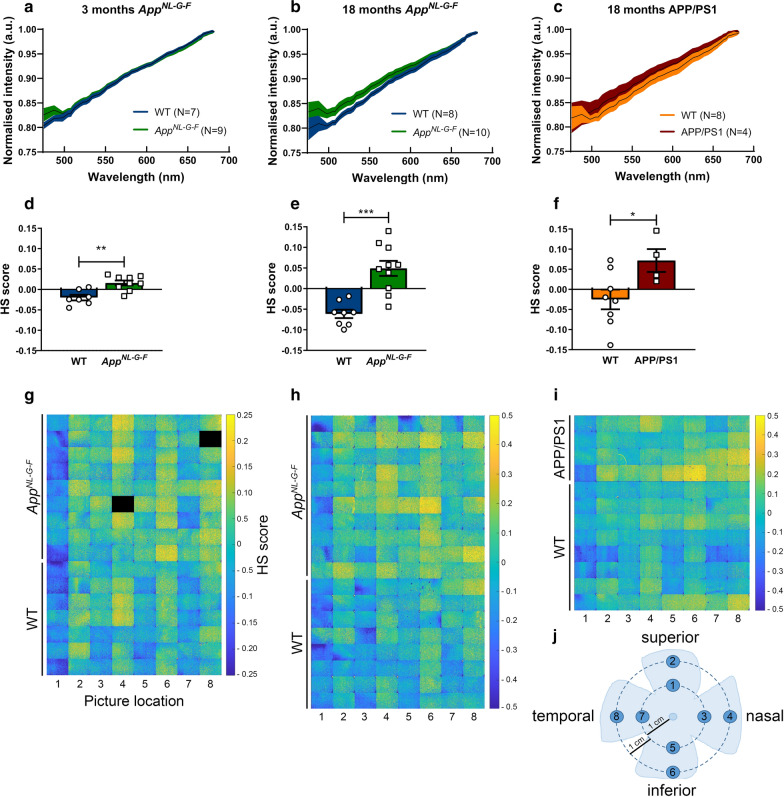
Fig. 2.
Quantification of retinal Aβ burden via hyperspectral imaging reveals progressive retinal amyloidosis in AppNL-G-F mice. a Average spectra of 3-month-old AppNL-G-F and WT mice are different, with a clear separation in the short wavelength range. b Average spectra of 18-month-old AppNL-G-F and WT mice show significant spectral differences for all wavelengths up to 600 nm. c Average spectra of 18-month-old APP/PS1 and WT mice show significant spectral differences from ~ 500 to ~ 600 nm. Data are shown as mean ± 95% confidence intervals. d, e For both ages, comparison of hyperspectral (HS) scores (obtained by compression of the spectral information to maximize between group separation) of AppNL-G-F and WT mice shows a strong effect size and significant difference between genotypes. Unpaired two-tailed t-tests (t14 = 3.957, p = 0.0014 at 3 months; t16 = 4.919,p = 0.0002 at 18 months); n = 8–10. f HS scores of 18-month-old APP/PS1 and WT mice are significantly different. Unpaired two-tailed t-tests (t10 = 2.395,p = 0.0376); n = 4–8. g–i Heatmaps with a spatial representation of the HS score per image for each mouse. Note that image fields 2, 4, 6 and 8, which correspond to the peripheral retinal locations, have higher scores, indicative for a higher amyloid load. j Schematic representation of the retinal imaging locations

