Fig. 3.
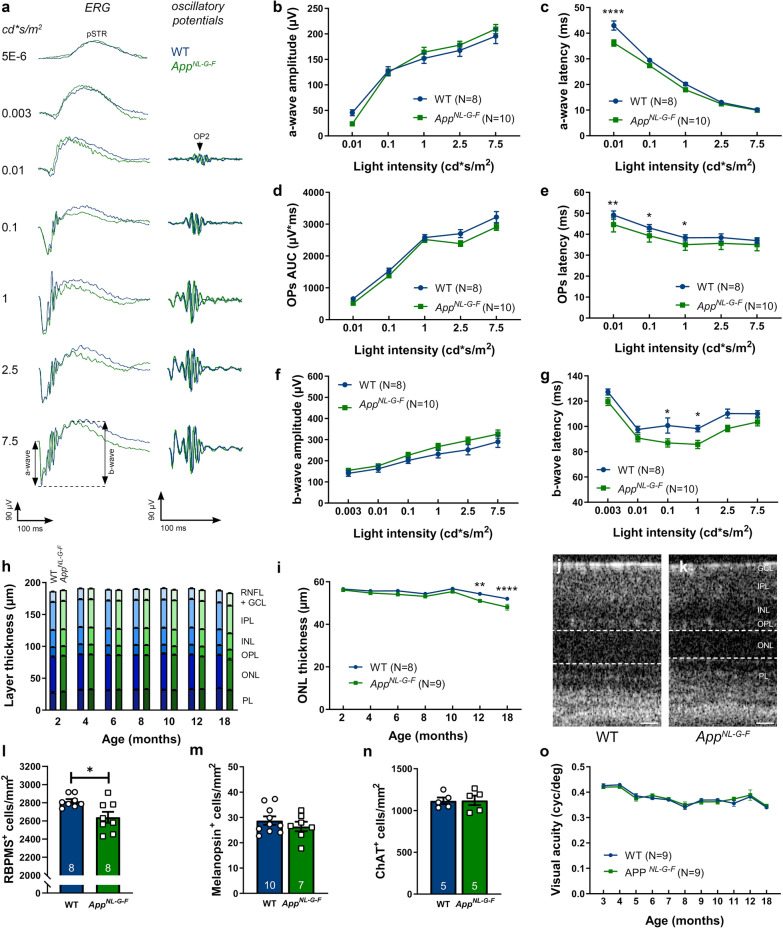
Neuronal dysfunction yet no degeneration in the retina of AppNL-G-F mice. a Representative electroretinogram measurements, with increasing light intensities, in 18-month-old AppNL-G-F (green) and WT (blue) mice. b, c The amplitude of the a-wave is unaffected in AppNL-G-F mice of 18 months (b), yet the latency time is decreased for the lowest light intensity (c). Two-way ANOVA with Sidak’s multiple comparisons test (F1,85 = 23.14 for the effect of genotype, p < 0.0001); n = 8–10. d, e Oscillatory potentials show a similar wave front (measured as the area under the curve, AUC) (d), but a reduced latency in 18-month-old AppNL-G-F mice (e), compared to WT. Two-way ANOVA with Sidak’s multiple comparisons test (F1,80 = 37.14 for the effect of genotype, p = 0.0013, 0.0124, 0.0378 for 0.01, 0.1 and 1 cd*s/m2 respectively); n = 8–10. f, g Similarly, the amplitude of the b-wave is unaltered (f), but the latency time is decreased in 18-month-old AppNL-G-F mice compared to WT mice (g). Two-way ANOVA with Sidak’s multiple comparisons test (F1,97 = 27.90 for the effect of genotype, p = 0.0206 and 0.044 for 0.1 and 1 cd*s/m2); n = 8–10. Full electroretinogram data is given in Supplementary Fig. 2. h, i Analysis of the thickness of the retinal layers, as measured by optical coherence tomography, shows no differences between AppNL-G-F and WT mice from 2 to 18 months of age (h), with the exception of a thinning of the outer nuclear layer (i). Two-way ANOVA with Sidak’s multiple comparisons test (F1,106 = 32.14 for the effect of genotype, p = 0.0016 and p < 0.0001 for 12 and 18 months, respectively); n = 8–9. j, k Representative optical coherence tomography images of WT (j) and AppNL-G-F (k) retinas. Dotted lines delineate the outer nuclear layer. l Quantification of RBPMS+ retinal ganglion cell density reveals ganglion cell loss in 18-month-old AppNL-G-F compared to WT mice. Unpaired two-tailed t test (t14 = 2.745,p = 0.0158); n = 8. m, n Cell counts of melanopsin+ ganglion cells (m) and ChAT+ neurons (n) show no differences in numbers between 18-month-old AppNL-G-F and WT mice. o A longitudinal study of visual acuity in AppNL-G-F mice from 3 till 18 months revealed a decrease with age but no genotype differences. Two-way ANOVA (F10,180 = 21.11 for the effect of age, F1,180 = 0.1149 for the effect of genotype); n = 9. Scale bar: 25 µm. Data are depicted as mean ± SEM; RNFL = retinal nerve fiber layer, GCL = ganglion cell layer, IPL = inner plexiform layer, INL = inner nuclear layer, OPL = outer plexiform layer, ONL = outer nuclear layer, PL = photoreceptor layer

