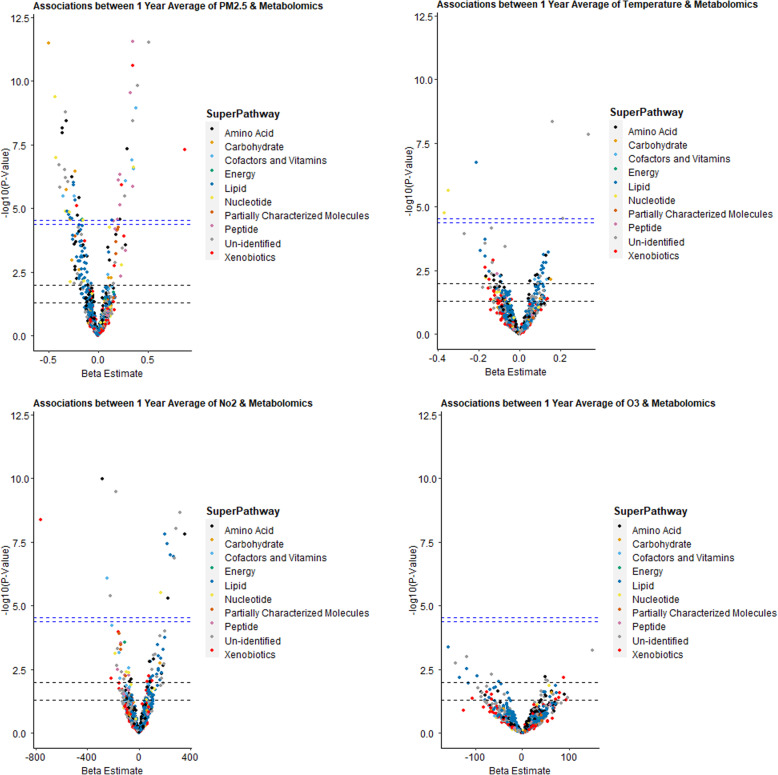
Fig. 1.
Volcano Plots presenting the adjusted associations between long-term exposures to air pollutants and temperature with metabolomics (multi-pollutant models). These models were linear mixed-effect regression models (LMEM) with random participant-specific intercepts and simultaneously adjusted for PM2.5, NO2, O3, and temperature (multi-pollutant models) for the same exposure window. All models were adjusted for age (years), body mass index (kg/m2), cigarette pack-years, alcohol intake (< or ≥ 2 drinks per day), socioeconomic status (income payment and years of education), season (warm/cold), and relative humidity. The transverse dashed lines represent different statistical significance levels of p-values (from lower to upper): 0.05, 0.01, ENT95%, and ENT99%. Note the different scale of the X axes. Abbreviations: ENT: Effective/independent number of tests; log10, logarithmic base 10; PM2.5, particulate matter ≤2.5 μm; NO2, nitrogen dioxide; and O3, ozone

