Fig. 6.
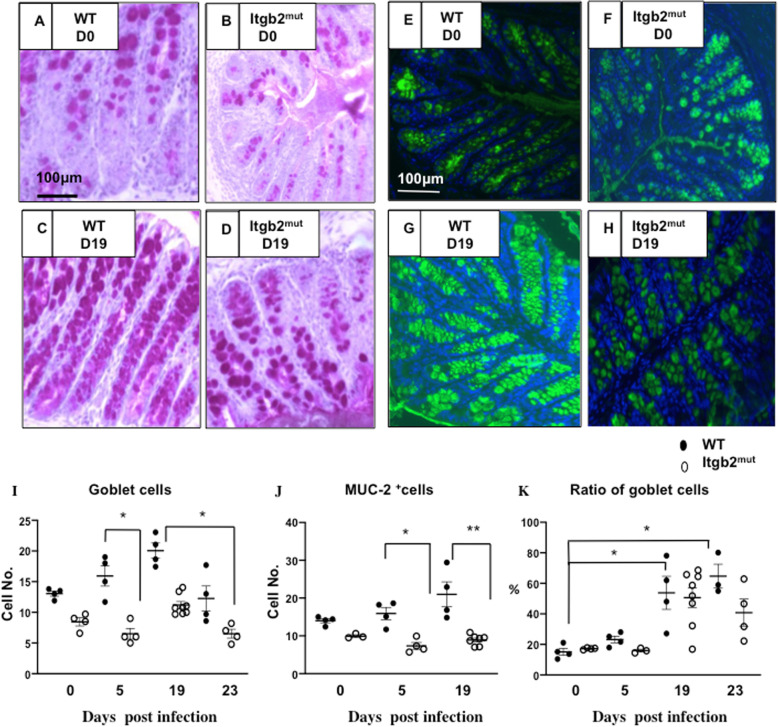
Itgb2mut mice did not develop infection induced goblet cell hyperplasia in response to infection with T. muris and had fewer MUC-2 expressing cells in the colon than littermate controls in response to infection. Itgb2mut and WT littermate controls mice were infected with 200 embryonated T. muris eggs and harvested at Day 0 (D0) (a, b), D5, and D19 (c, d) post-infection. Representative images of colons taken from one of two experiments that were assessed by PAS staining for the quantification of goblet cells (a-d) or Muc2 to identify mucin-2 expressing cells (e-h). Images were analysed using Image J software and (i) the number of goblet cells, (j) the number of Muc-2 expressing cells, and (k) the ratio of goblet to epithelial cells were calculated as the mean of 20 measurements /tissue section, n = 4–8/time point. *(P < 0.05), (**p < 0.01)

