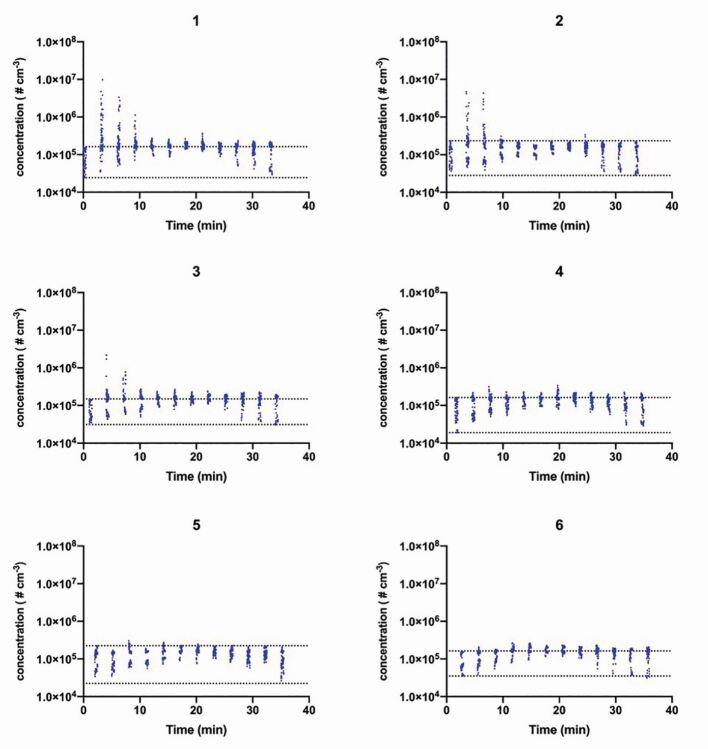
Fig. 5.
Total particle concentration generated during AGPs in the presence of HVS(IO), HVS(EO) and ACS (group E; Table 2) at each air sampling location (1-6; Table 1). Acquisition of air samples were performed during the baseline period (0-3 minutes), during the six procedures (3-21 minutes) and following cessation of procedures (21-36 minutes). Dotted lines indicate the upper and lower boundaries of the baseline data. Each data point represents the sum of particles measured by HR-ELPI over one second during each replicate (n = 3)

