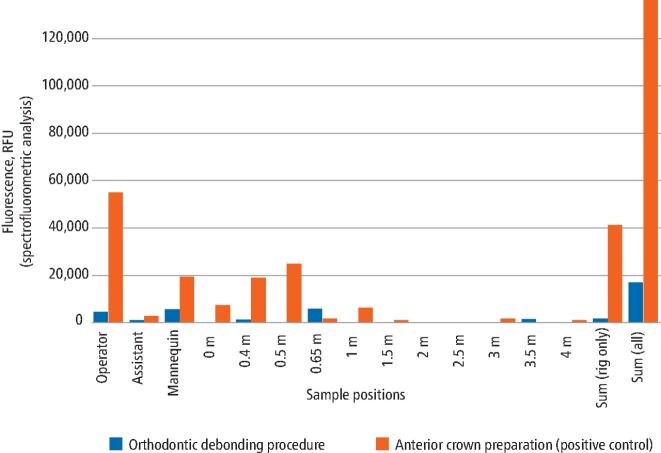
Fig. 4.
Bar chart comparing the spectrofluorometric analysis data by clinical procedure and sample type/location (RFU = relative fluorescence units). Spectrofluorometric analysis data from each area were combined for all repetitions (that is, all samples on the operator, assistant, mannequin and those at 0.5 m, 1 m, 1.5 m etc from the centre). Note that 0.4 m and 0.65 m readings were located on the mannequin

