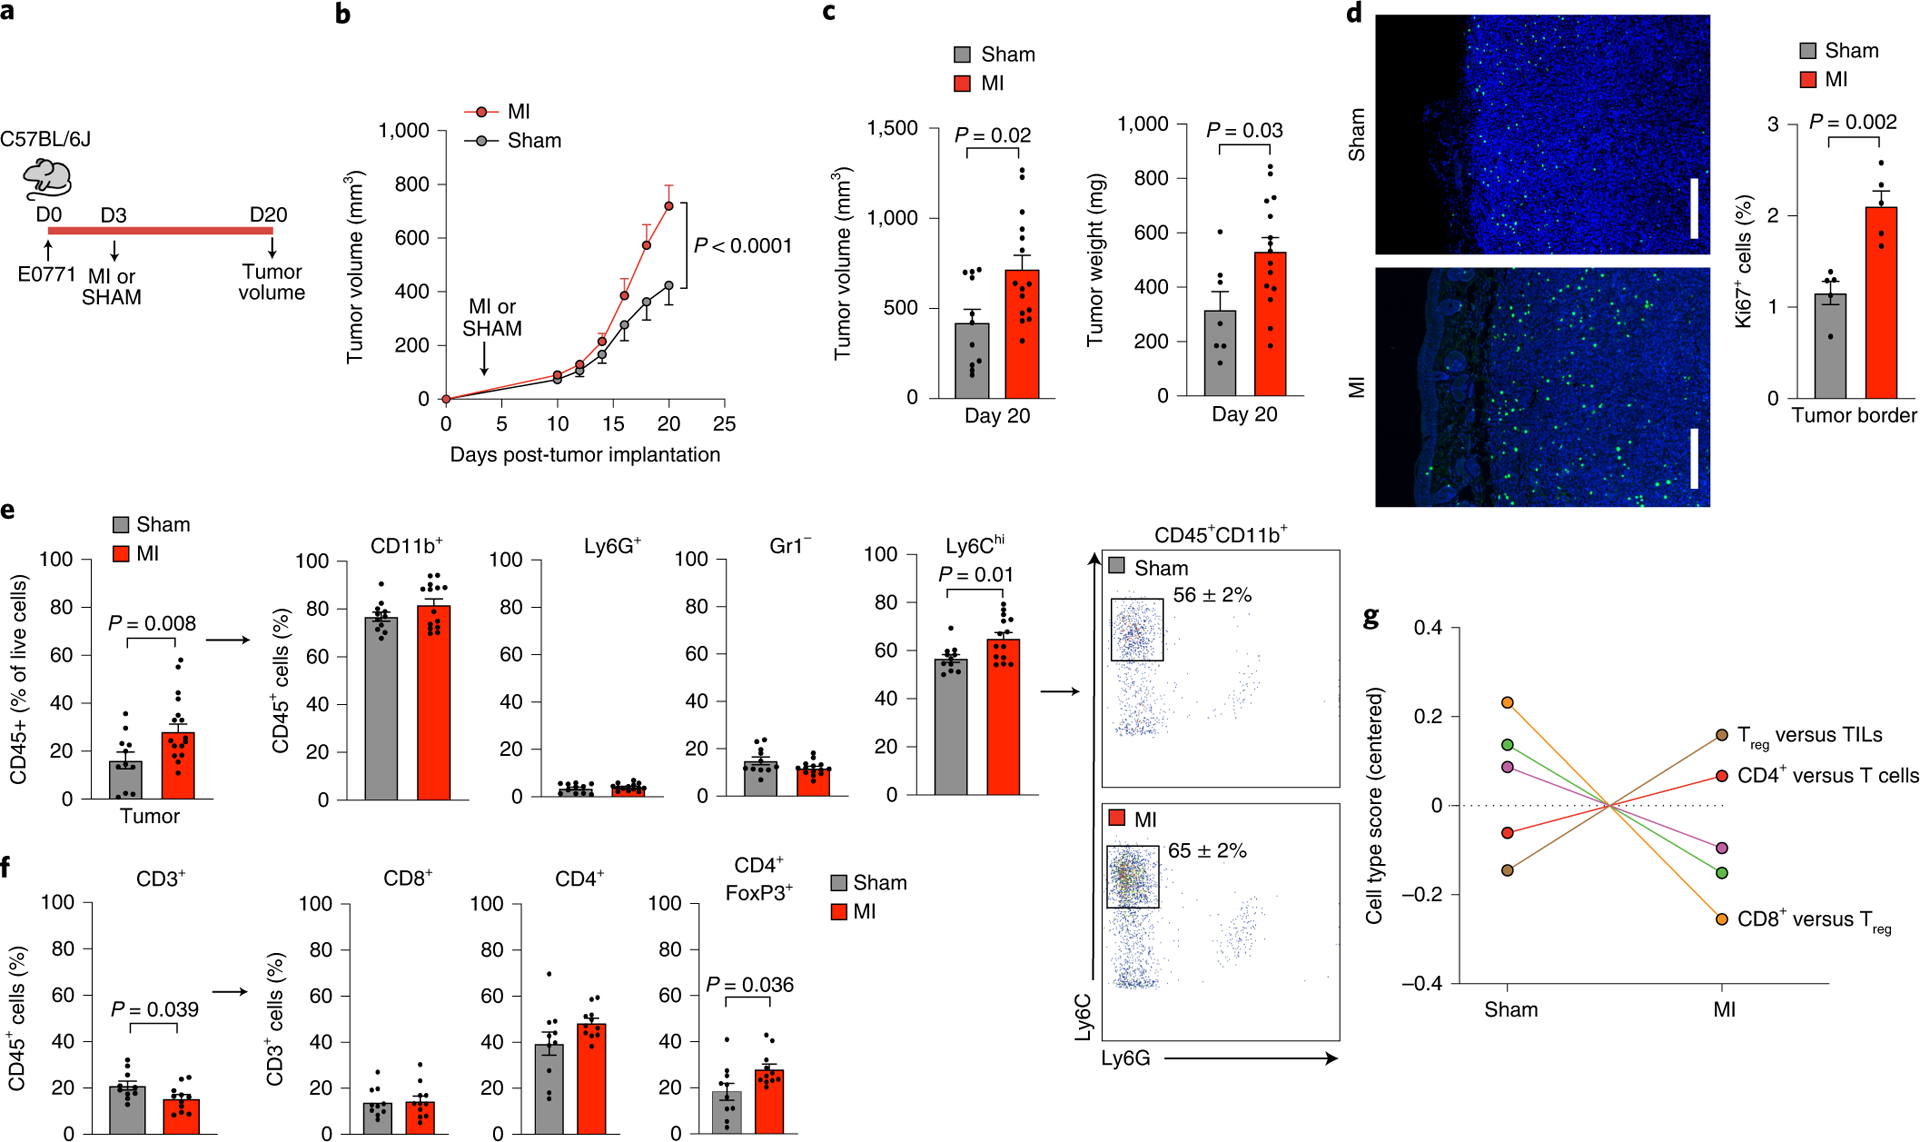
Figure 1. Surgically-induced myocardial infarction accelerates tumor growth in a syngeneic mouse model of breast cancer.

(a) Coronary artery ligation or sham surgery was performed 3 days following orthotopic implantation of E0771 cancer cells into the mammary fat pad of C57BL/6J mice and tumor growth was followed over the course of 20 days. (b) Tumor growth over 20 days following tumor implantation (n=15 MI, 11 sham) (c) Quantification of tumor volume (n=15 MI, 11 sham) and weight (n=15 MI, 7 sham) at sacrifice. (d) Representative images of tumors stained for Ki67 to detect proliferating cells in the tumor border (left) and quantification of Ki67+ cells (right) (n=5/group). Scale bar represents 250 μm. (e) Left, flow cytometric analysis of tumor immune cells (CD45+) at day 20 to identify myeloid subsets (n=14 MI, 11 sham): CD11b+Ly6G+, neutrophils; CD11b+Gr1–, macrophage-like cells; CD11b+Ly6Chi, monocytes. Right, representative gating showing increased percentage of CD45+CD11b+Ly6G–Ly6Chi monocytes in MI compared to sham mice. (f) Flow cytometric analysis of tumor immune cells (CD45+) at day 20 to identify lymphoid subsets (n=11 MI, 10 sham): CD3+, T cells; CD8+, cytotoxic T cells; CD4+, T helper cells; CD4+FoxP3+, regulatory T cells. (g) Nanostring immune profiling gene set analysis of tumor RNA from MI (n=11) or sham (n=10) mice. TILs, tumor infiltrating lymphocytes. Two (f,g), three (d,e) and five (b,c) independent experiments were conducted. Data are the mean ± s.e.m. P values were calculated using a repeated measures analysis of variance (ANOVA) with Bonferroni’s multiple comparisons test (b) or two-tailed unpaired Student’s t-test (c [tumor volume], d, e [Ly6C, Gr1, CD3, CD8, CD4]) or two-tailed Mann–Whitney U-test (c [tumor weight], e [CD11b, Ly6G, FoxP3]).
