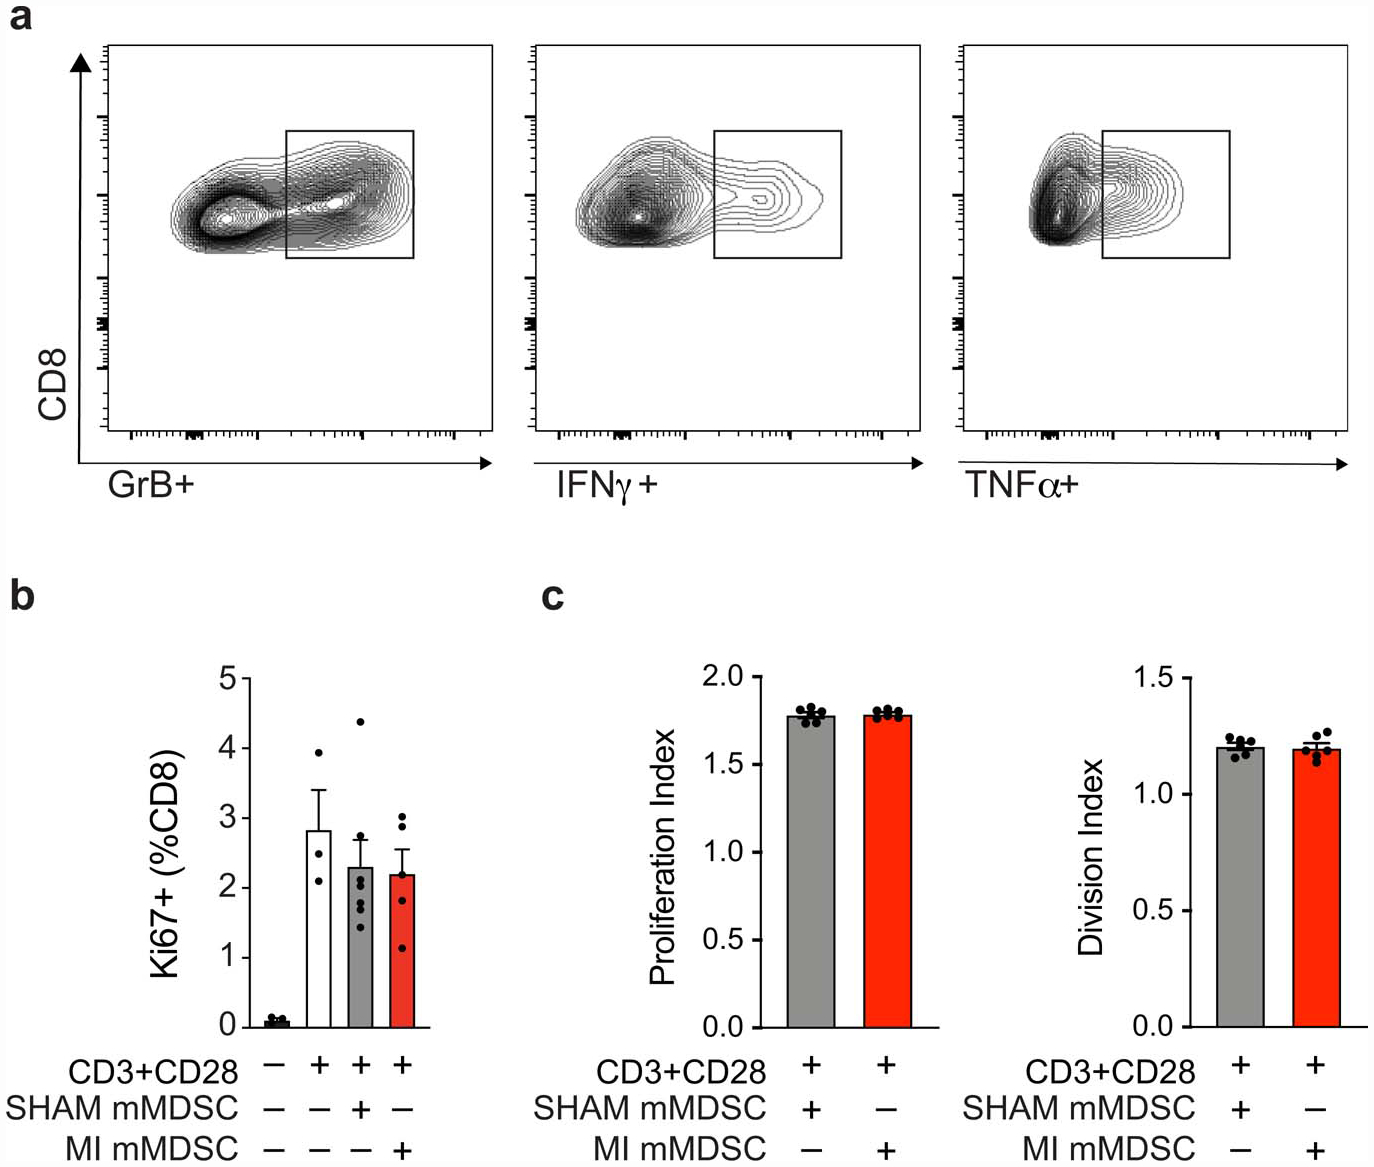
Extended Data Fig. 7. Monocytic myeloid-derived suppressor cells isolated from tumors of mice exposed to MI or sham surgery do not alter the proliferation of T cells in vitro.

(a) Representative flow plots of CD11b-Ly6C-CD8+ T cells from MDSC:T cell suppression assay, representing % IFNγ +, TNFα+, Granzyme B (GrB)+ populations. (b,c) Purified splenic CD8+ T cells from naïve mice were stimulated with αCD3/αCD28 for 72 hours in the presence of mMDSCs isolated from tumors from mice exposed to MI (n=5) or sham surgery (n=7), and CD8+ T cell proliferation was assessed by % Ki67 (b) and replication and division index (c) using a cell trace proliferation dye. (a,b,c) two independent experiments were conducted. Data are the mean ± s.e.m. P values were calculated using or two-tailed unpaired Student’s t-test (b,c), where relevant comparisons were not significant (p>0.05)
