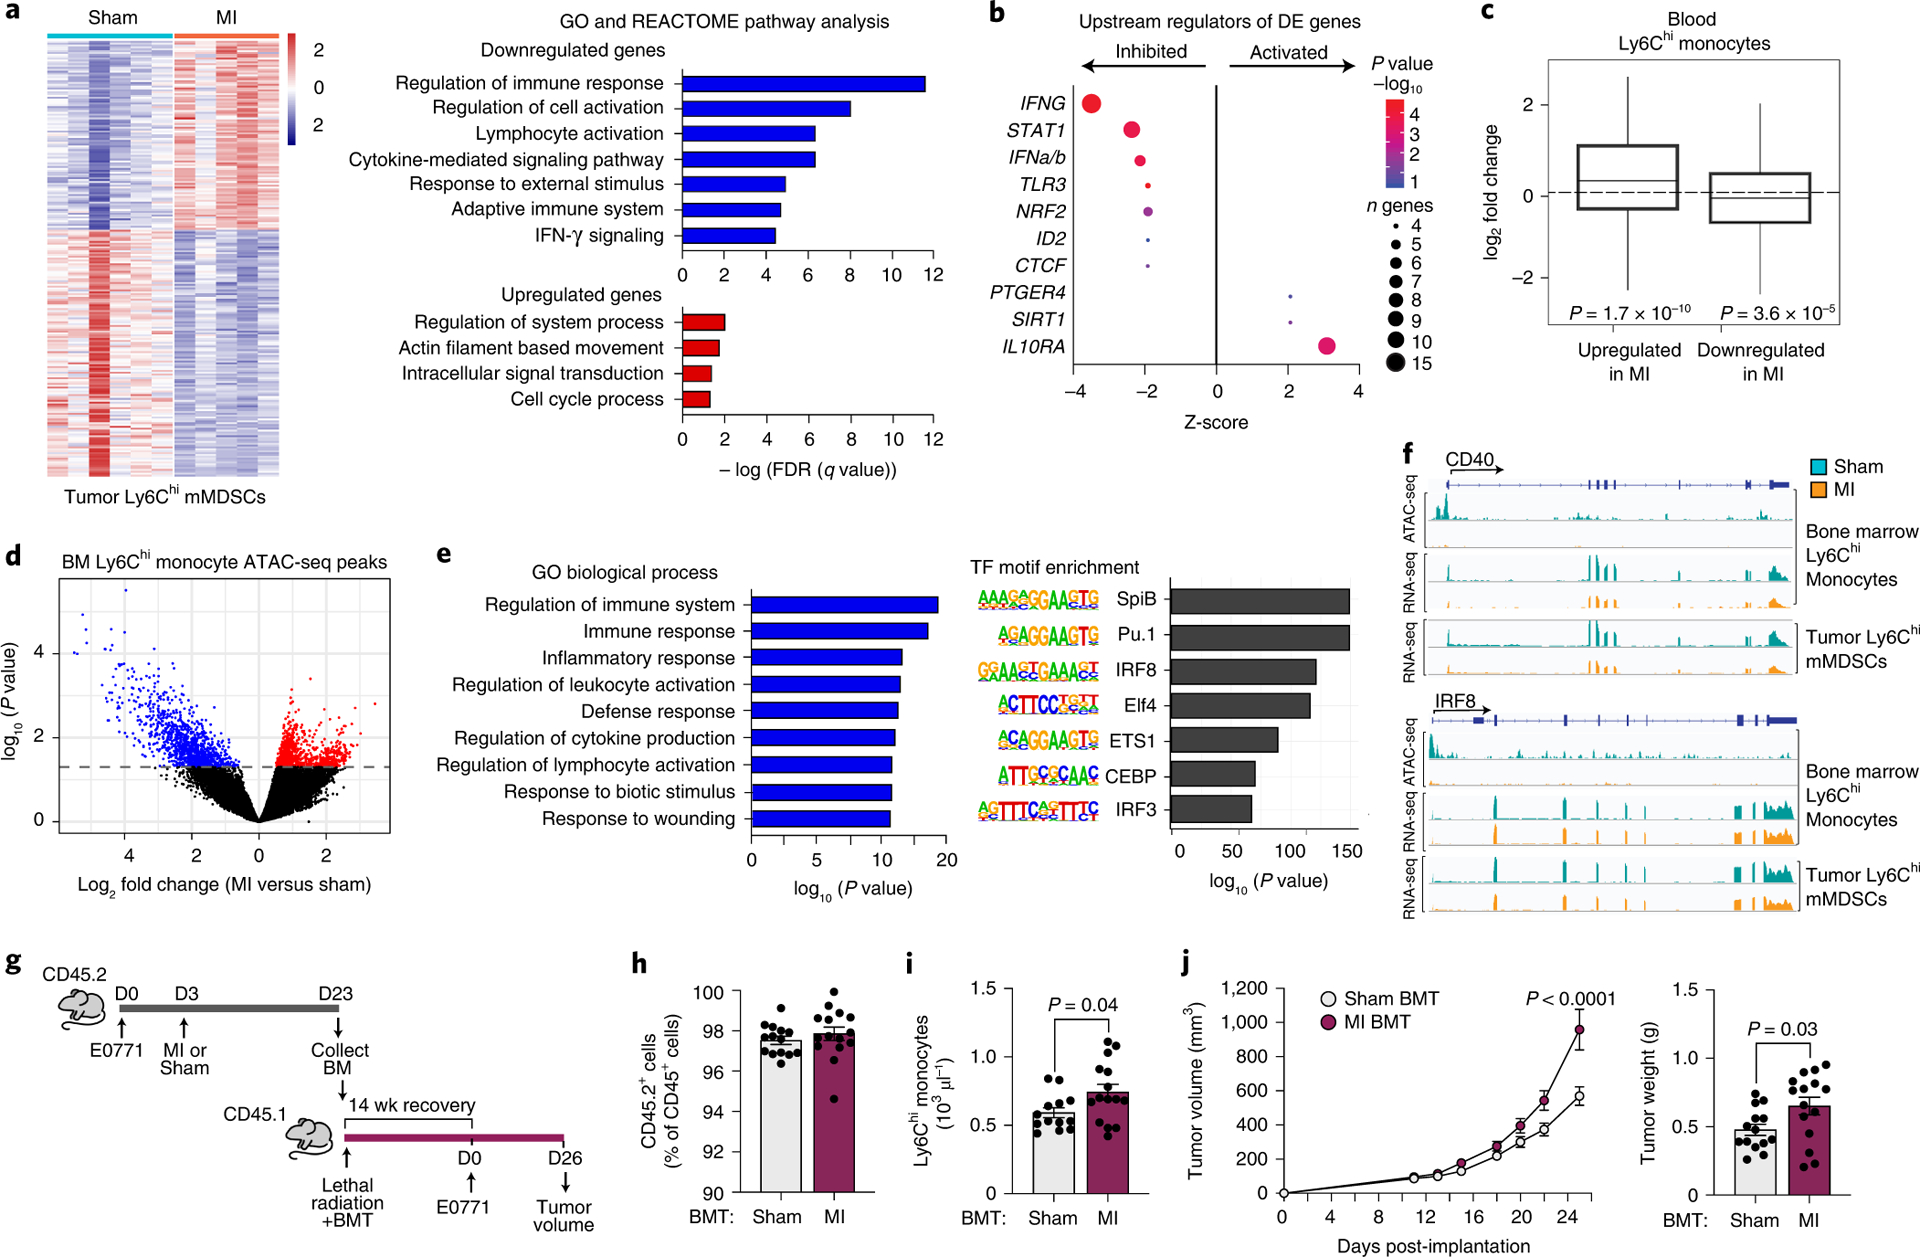
Figure 3. Tumoral Ly6Chigh monocytic myeloid derived suppressor cells (mMDSCs) exhibit an MI-induced immunosuppressive transcriptional phenotype that is epigenetically imprinted in the bone marrow.

(a) Left, heat map showing RNA-Seq gene expression changes (n=235 genes) in tumoral CD11b+Ly6Chigh mMDSCs from mice 17 days post-MI (n=5) or sham (n=6) surgery (Padj<0.1). Right, functional enrichment analyses of differentially-expressed genes in tumoral mMDSCs from MI and sham mice. (b) Upstream regulator analyses of genes from a. n, number of differentially expressed (DE) genes regulated per factor, with color denoting p value (-log10). (c) Gene set concordance analysis, which shows that the 1000 top DE genes up- and down-regulated in tumor CD11b+Ly6Chigh mMDSCs (n=5 MI, n=6 sham) are up- and down-regulated in blood Ly6Chigh monocytes at 9 days after MI, as compared to background gene expression. Box: interquartile range (IQR); line: median; whiskers: most extreme value within 1.5x the IQR. (d) Volcano plot showing chromatin loci identified by ATAC-Seq to be more (red, n=942 peaks) or less (blue, 1101 peaks) accessible in bone marrow Ly6Chigh monocytes from mice exposed to MI (n=4, 2 pools of two mice) as compared to sham surgery (n=8, 4 pools of two mice) (P<0.05). (e) Gene ontology (GO) (left) and transcription factor binding motif enrichment (right) analyses of less accessible chromatin regions (n=1101 peaks) in bone marrow Ly6Chigh monocytes from mice exposed to MI as compared to sham surgery. (f) ATAC-Seq (top) and RNA-Seq (bottom) reads in bone marrow and tumor Ly6Chigh monocytes at selected gene loci. (g) Bone marrow (CD45.2+) was isolated from mice 20 days after tumor implantation and 17 days after MI (n=5) or sham (n=5) surgery and was pooled in PBS and transplanted into lethally irradiated C57BL/6J mice (CD45.1+) mice. 14 weeks after transplantation, E0771 tumors were implanted and tumor volume was assessed over the course of 26 days. BMT, bone marrow transplantation. (h,i) CD45.2/CD45.1 chimerism (sham, n=14 and MI, n=15) (h) and circulating monocyte levels (sham, n=13 and MI, n=15) (i) in BMT recipients at 14 weeks after transplantation. (j) E0771 tumor volume over 26 days (left) and tumor weight at day 26 (right) (sham, n=14 and MI, n=15). Data are the mean ± s.e.m. P(adj) values were calculated using the Benjamini-Hochberg method (a, left). FDR values were based on a permutation test (a, right). P values were calculated using a one-sided Fishers Exact test (b), two-sided Wilcoxon Rank-Sum Test (c), two-sided Wald test (d), hypergeometric distribution (left) and binomial distribution (right) (e), two-tailed unpaired Student’s t-test (h, i, j [right]), or a repeated measures analysis of variance (ANOVA) with Bonferroni’s multiple comparisons test or (j [left]).
