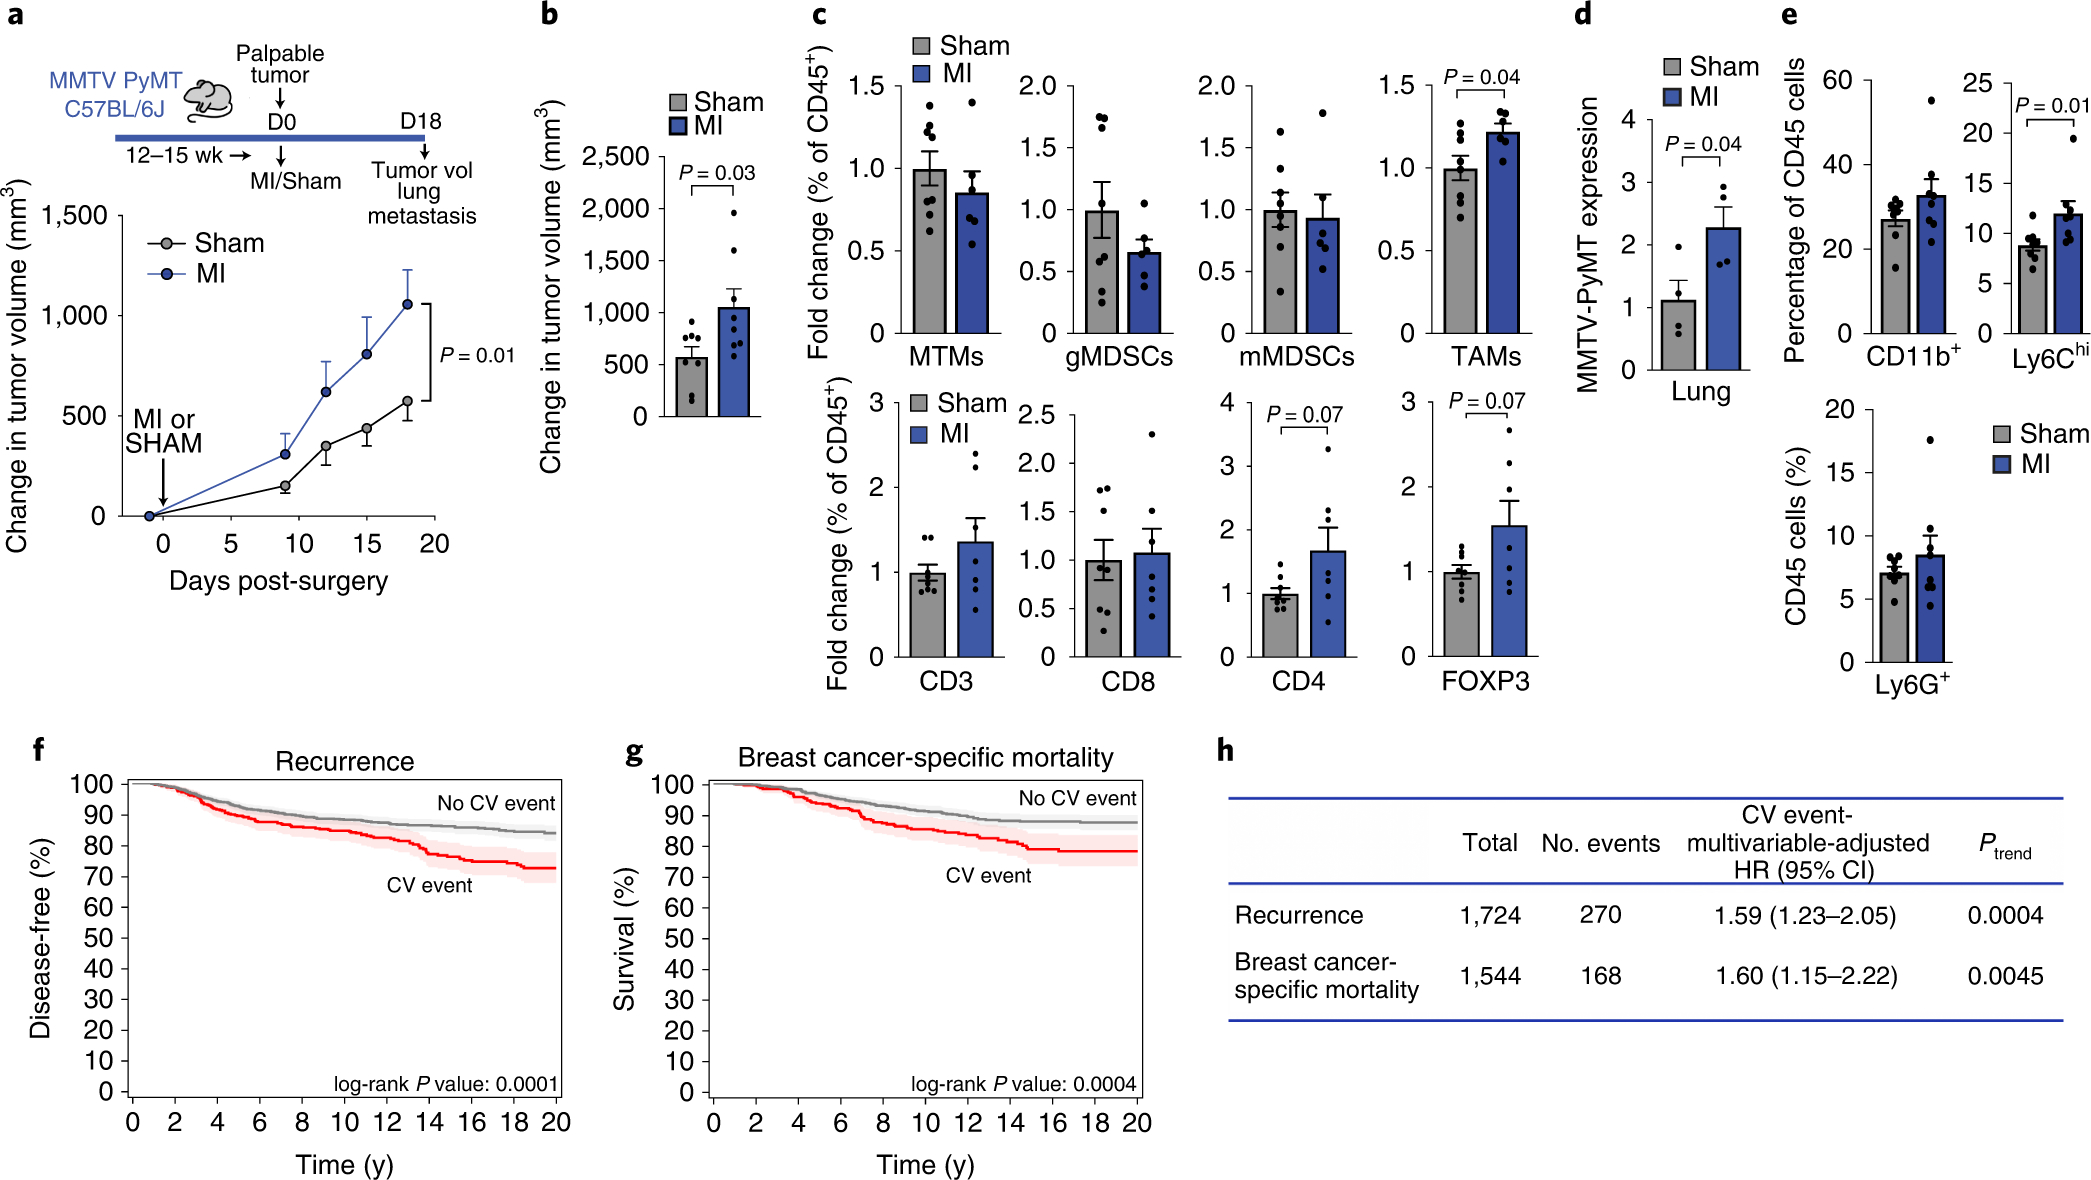
Figure 4. Myocardial infarction accelerates cancer progression in mice, and incident cardiovascular events increase the risk of recurrence and cancer-specific mortality in early-stage breast cancer patients.

(a) Top, coronary artery ligation or sham surgery was performed upon palpable tumor formation in MMTV-PyMT mice and cumulative tumor burden was followed over the course of 18 days, at which time tumor volume and metastatic burden were assessed. Bottom, quantification of tumor growth in the MMTV-PyMT genetically engineered mouse model of spontaneous breast cancer after MI or sham surgery (n=8/group). (b) Mean change in tumor volume at day 18 as compared to day 0 after MI or sham surgery (n=8/group). (c) Flow cytometric analysis of tumor myeloid cells (top: n=6 MI, 8 sham) and lymphoid cells (bottom: (n=7 MI, 8 sham) at day 18 after MI or sham surgery. Mammary tissue macrophages (MTM: CD11bhighMHCII+); granulocytic myeloid derived suppressor cell (gMDSC: CD11bhighMHCII−Ly6CloLy6Ghi); monocytic myeloid derived suppressor cell (mMDSC: CD11bhighMHCII−Ly6ChiLy6Glo); tumor-associated macrophage (TAM: CD11bloMHCIIhi); CD3+, T cells; CD8+, cytotoxic T cells; CD4+, T helper cells; CD4+FoxP3+, regulatory T cells. (d) Analysis of mammary-specific Pymt mRNA levels in the lungs of MI and sham mice with similar sized tumors at sacrifice (n=4/group). (e) Flow cytometric analysis of myeloid cells in the lungs of MMTV-PyMT mice (n=8/group) at day 18 after MI or sham surgery; CD11b+Gr1–, macrophages; CD11b+Ly6G+, neutrophils; CD11b+Ly6Chi, monocytes. (f-g) Kaplan Meier curves for cancer recurrence (f) and breast cancer-related mortality (g) in patients with early-stage breast cancer (n=1,724) who experienced a post-diagnosis cardiovascular (CV) event. (h) Multivariable-adjusted hazard ratios adjusted for age, race, smoking status, body mass index at diagnosis date, tumor stage and adjuvant therapy (chemotherapy, radiation, endocrine therapy), utilizing traditional Cox proportional hazards regression models. All patient statistical tests were two sided. Three independent experiments (b-e) were conducted. Data are the mean ± s.e.m and P values were calculated using a repeated measures analysis of variance (ANOVA) with Bonferroni’s multiple comparisons test (a), a two-tailed Mann–Whitney U-test (e), or two-tailed unpaired Student’s t-test (b, c, d).
