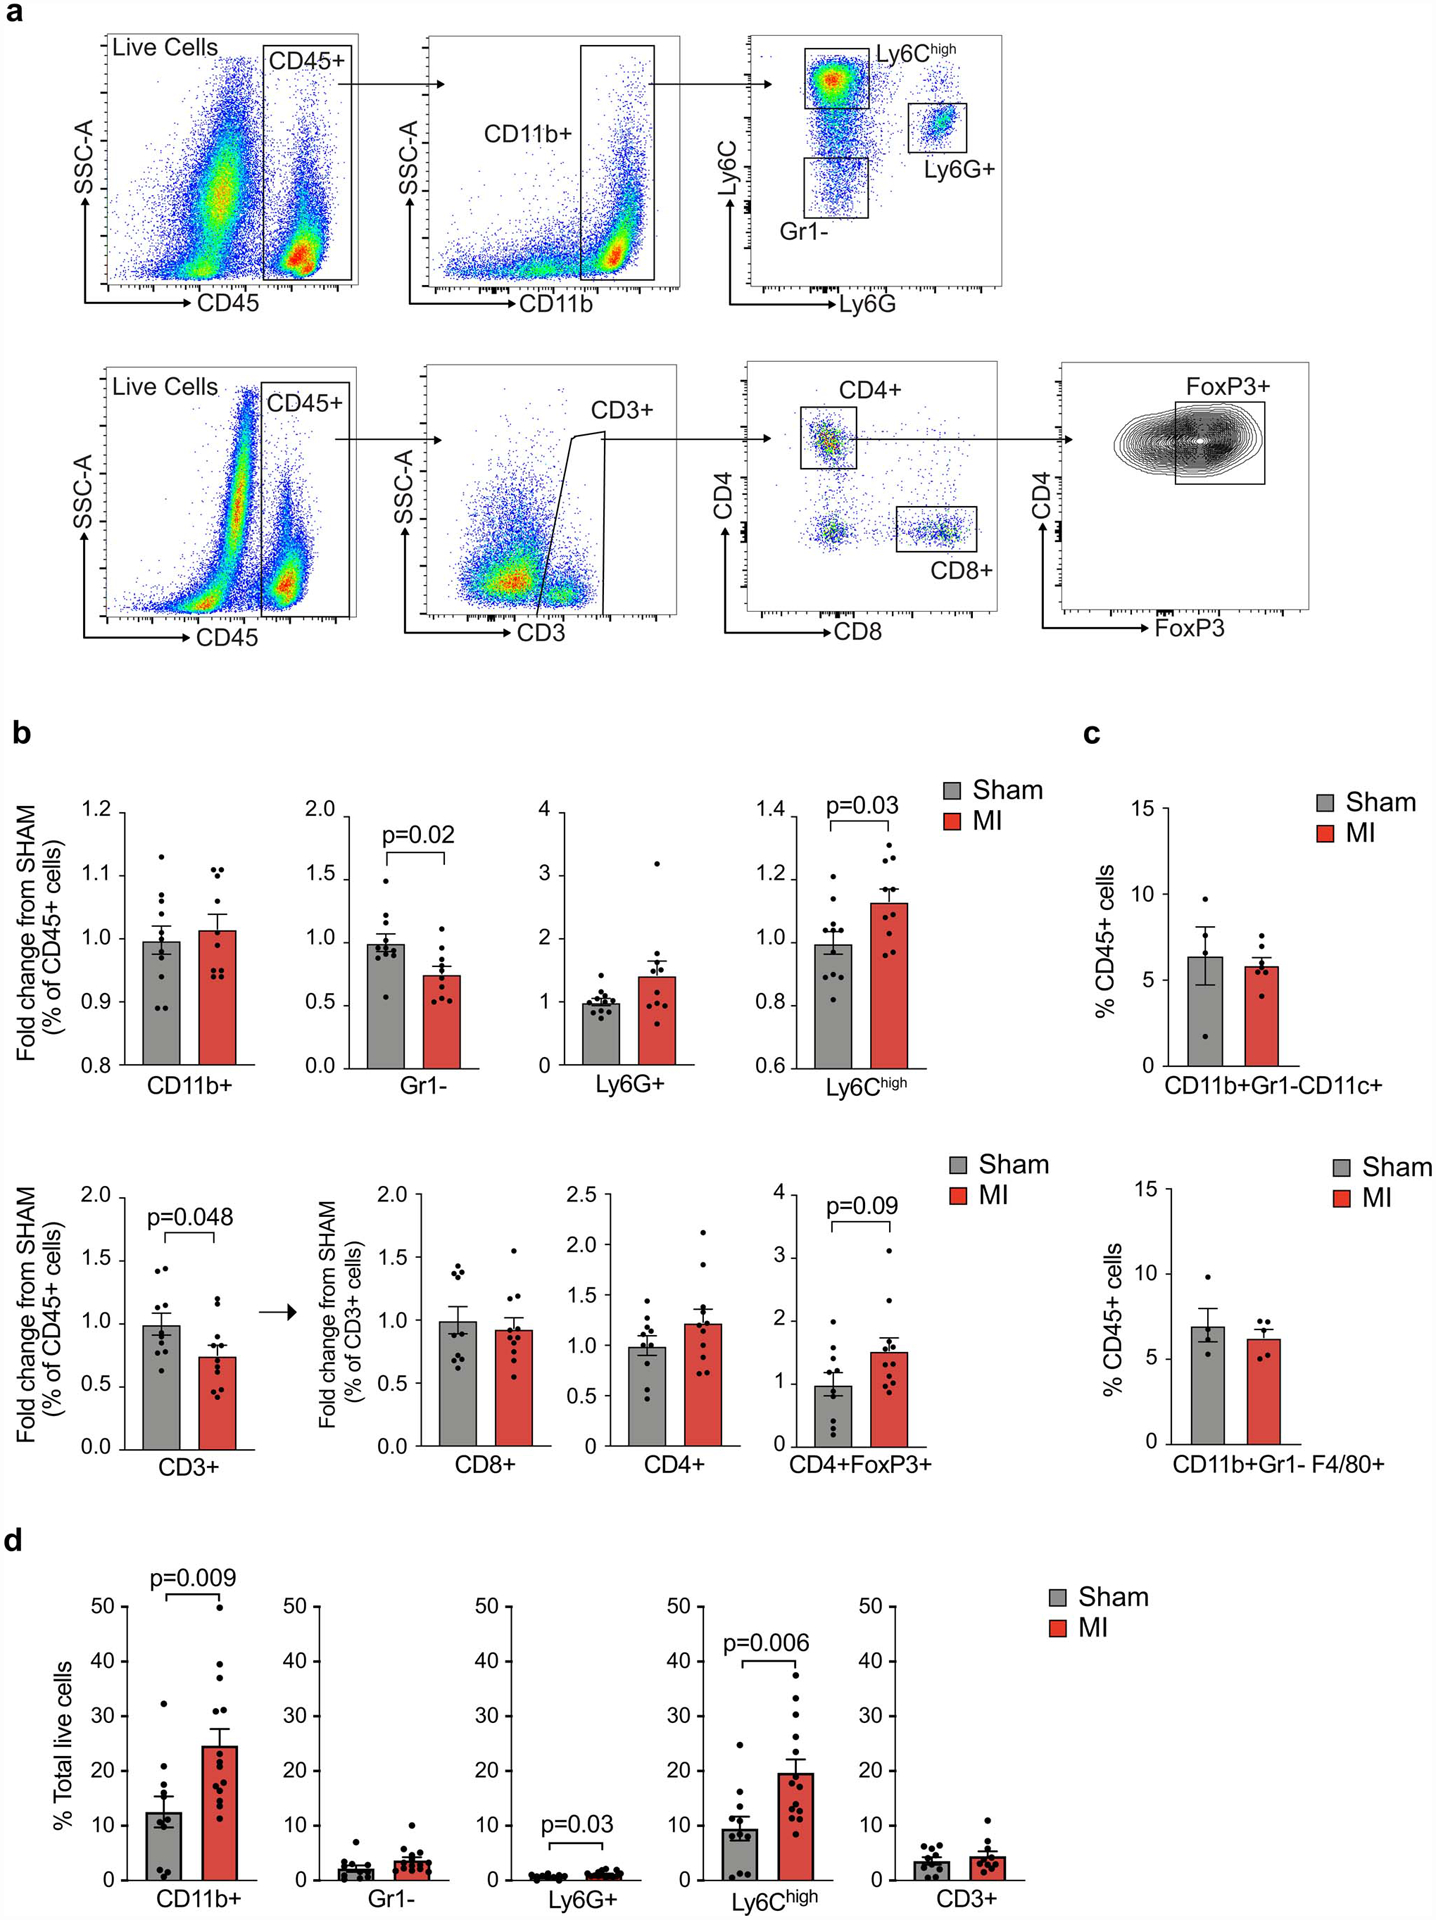
Extended Data Fig. 3. Flow cytometric analysis of intratumoral immune cells following MI or sham surgery.

(a) Flow cytometry gating strategy for myeloid (top) and lymphoid (bottom) cells in E0771 tumors. (b) Flow cytometric analysis showing the relative fold change in immune cell proportions in tumors from mice exposed to MI (n=11, red) vs sham (n=10, grey) surgery (day 20); two independent experiments were conducted. All populations were gated based on live/dead stain and CD45+. (c) Flow cytometric analysis of CD11b+Gr1-Cd11c+ dendritic cell-like and CD11b+Gr1+F4/80+ macrophage-like cells in E0771 tumors from mice exposed to MI (n=5) or sham (n=4) surgery. (d) Flow cytometric analysis of tumor immune cells (% total live cells) at day 20 to identify CD3+ T cells (n=11 MI, 10 sham) and CD11b+ myeloid (n=14 MI, 11 sham) subsets: CD11b+Ly6G+, neutrophils; CD11b+Gr1–, macrophage-like cells; CD11b+Ly6Chi, monocytes; Data are the mean ± s.e.m and P values in data were analyzed by a two-tailed Mann–Whitney test (b [FoxP3+ cells], or a two-tailed unpaired Student’s t-test (b,c,d).
