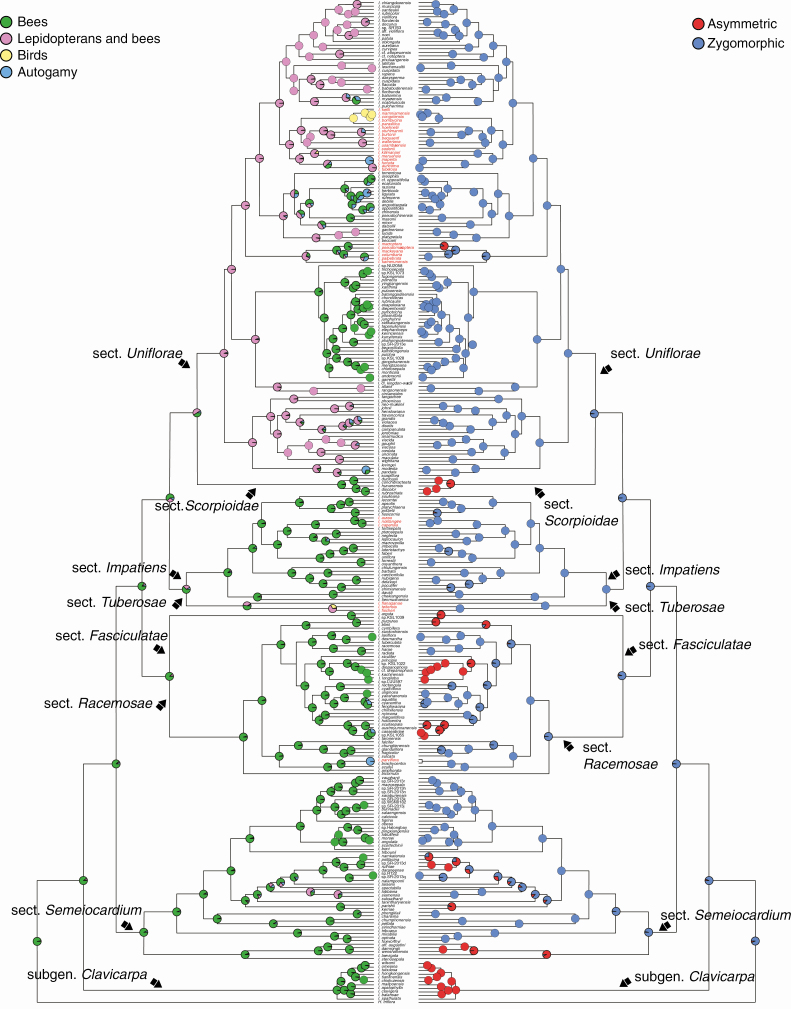
Fig. 3.
SIMMAP ancestral character state reconstruction of pollination syndromes (left) and corolla symmetry (right) on the maximum clade credibility tree from the combined BEAST analysis. Pie charts at nodes represent the posterior probability of states based on ten stochastic mappings. The names of species outside Asia are marked in red.

