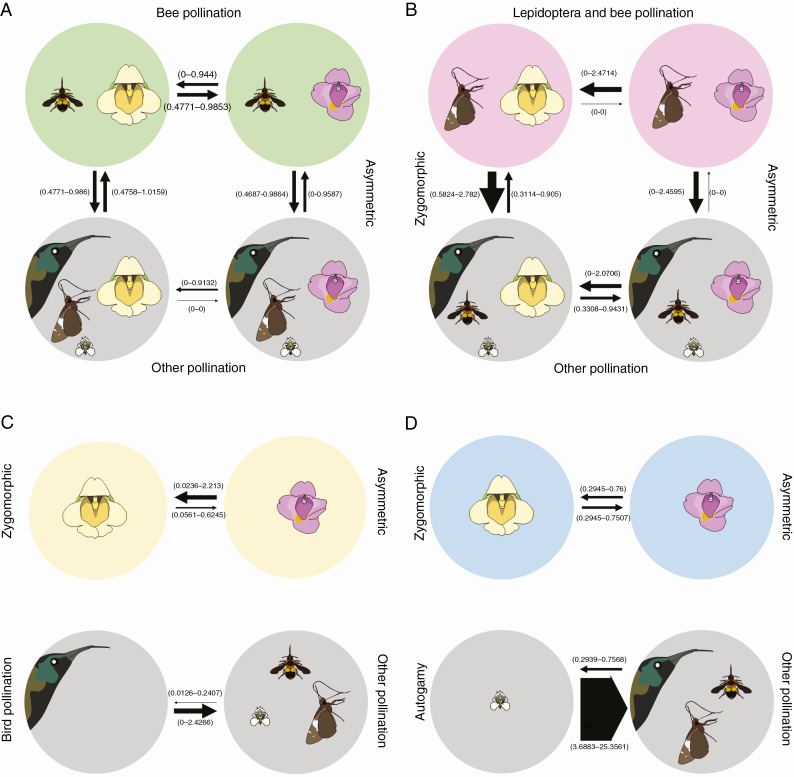
Fig. 4.
Analyses of correlated evolution between pollination syndromes and floral symmetry. Pollination syndromes were coded as binary characters (present vs. other). (A and B) Cases where the evolution of pollination syndrome and floral symmetry are dependent on each other, whereas in (C) and (D) they evolve independently. Arrow thickness represents the magnitude of the average transition rates across the RJ MCMC analysis based on the set of 900 trees resulting from the combined BEAST analysis. Values in parentheses represent the 95 % HPD of transition rates. (A) Bee pollination syndrome vs. other pollination syndromes. (B) Bimodal (Lepidoptera + bee) pollination syndrome vs. other pollination syndromes. (C) Bird pollination syndrome vs. other pollination syndromes. (D) Autogamy syndrome vs. other pollination syndromes.

