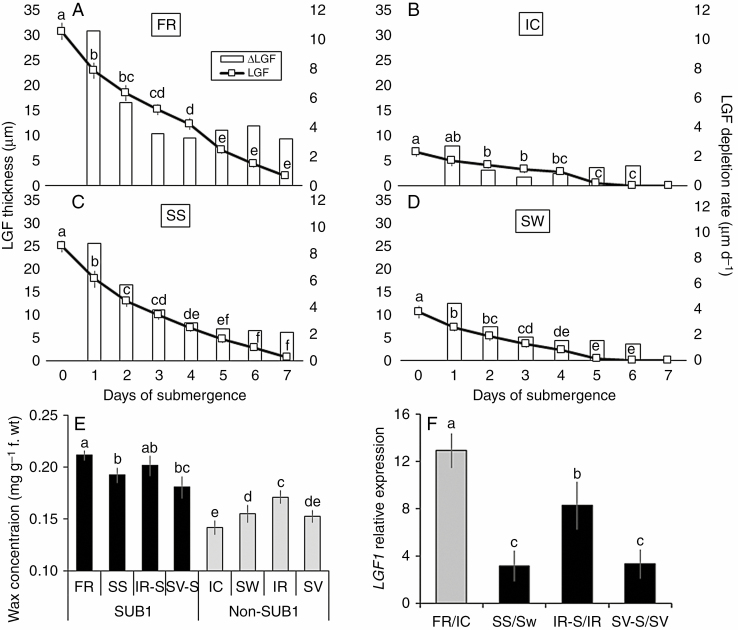
Fig. 1.
Periodic decline in leaf gas film (LFG) thickness under complete submergence over a period of 7 d (line diagram) and corresponding rate of LGF depletion (histogram) represented graphically for FR, FR13A (A), IC, IC450292 (B), SS, Swarna-Sub1 (C) and SW, Swarna (D), where the primary and secondary vertical axes correspond to LGF thickness (line diagram) and rate of LGF depletion (histogram), respectively. Here, the italicized name of the genotype marks it as Sub1 type, which is used uniformly for all figure legends. The initial content of epicuticular wax on leaf surfaces (E) and the relative expression level of the LGF1 gene in leaves (F) was measured before imposition of submergence stress in eight genotypes, i.e. Swarna, IR64, Savitri and their SUB1 introgressed counterparts, along with FR and IC. Relative change in LGF1 expression is shown in the SUB1 introgressed lines as compared with their non-Sub1 counterparts (shown as black bars), while the expression in FR was compared with respect to IC (shown in grey bar). The values presented are the mean ± s.e.m. (n = 3 for A–D; n = 5 for E and n = 3 for F), and values sharing the same letter are not significantly different (P < 0.05) according to Tukey’s multiple range test.

