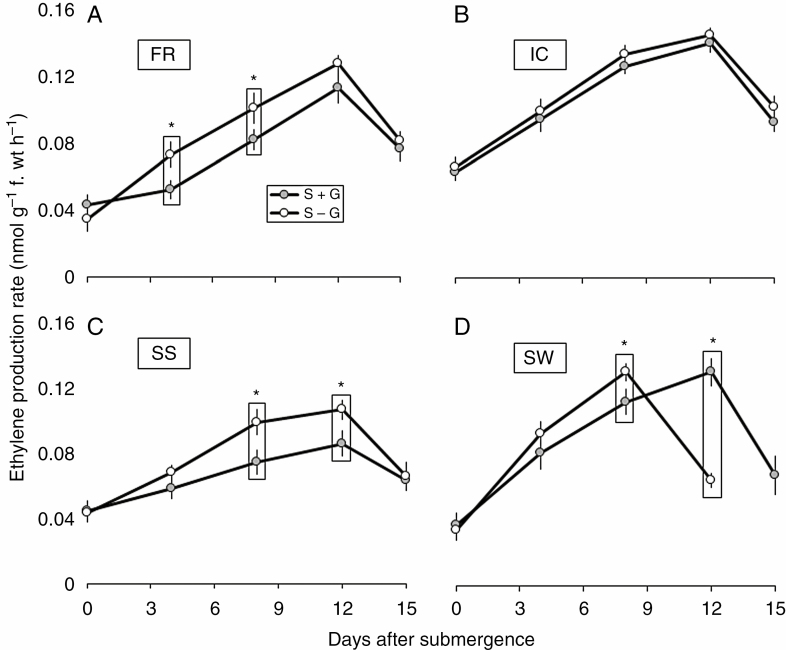
Fig. 4.
Periodic changes in rate of ethylene production in FR13A (A), IC450292 (B), Swarna-Sub1 (C) and Swarna (D) subjected to 14 d of complete submergence with (S + G) and without (S – G) a leaf gas film. The values presented are the mean ± s.e.m. (n = 3), and the data points marked by a box with ‘*’ at the top denote a significant difference (P < 0.05) between (S + G) and (S – G) treatments according to Tukey’s multiple range test.

