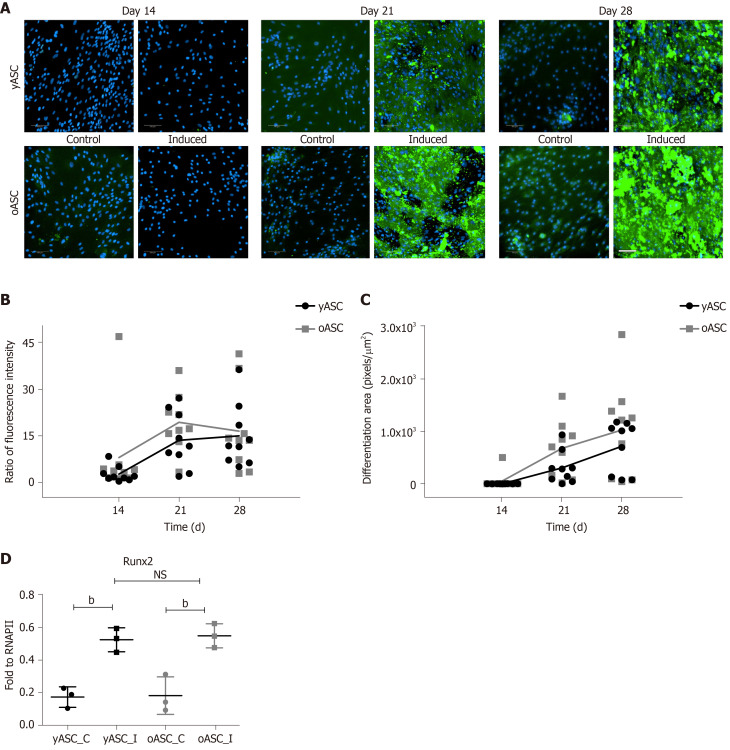
Figure 4.
Analysis of osteogenic differentiation. A: Representative images of noninduced (control) and osteogenic-induced young and old human adipose-derived stromal/stem cells (yASCs and oASCs) for 14 d, 21 d and 28 d. Hydroxyapatite deposits were stained green with Osteoimage™, and nuclei were stained blue by DAPI (scale bar: 100 μm). B: Quantitative analysis was performed by measuring the fluorescence of Osteoimage™ stain (fluorescence microplate reader); C: Quantitative analysis was performed by measuring the intracellular stained area with Osteoimage™ (Operetta®); D: Expression levels of Runx2 mRNA after osteogenic induction of yASCs and oASCs. Data are represented as the mean ± SD and are compared using a t test. NS: Nonsignificant differences.

