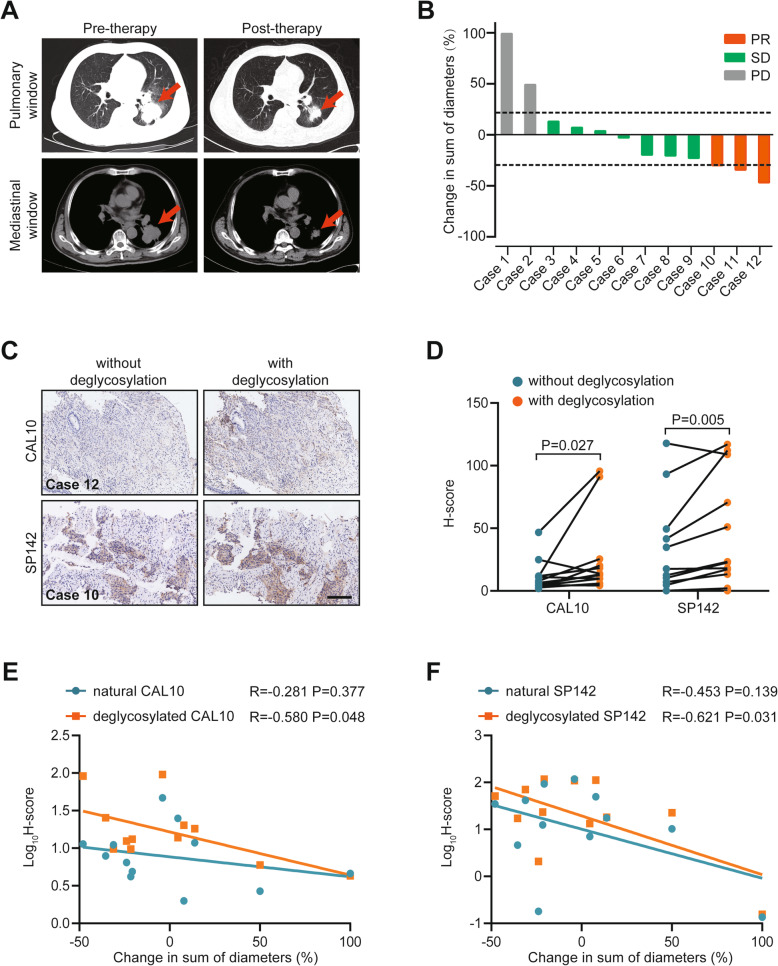
Fig. 3.
Associations between deglycosylated PD-L1 levels and response to anti-PD-1 therapy. (A) Representative CT images show one patient who derived a substantial benefit from camrelizumab. (B) Overview of the relative change in sum of diameters in the recruited cohort. (C) Representative images show samples from the recruited cohort that were stained with each of the 2 PD-L1 mAbs (CAL10 and SP142) with or without sample deglycosylation. Bar = 200 μm. (D) H-score of PD-L1 signal intensity after staining with 2 PD-L1 mAbs with or without sample deglycosylation. (E, F) Correlation between the H-score of PD-L1 after staining with CAL10 and SP142 mAbs before and after sample deglycosylation and the relative change in sum of diameters

