Fig. 2.
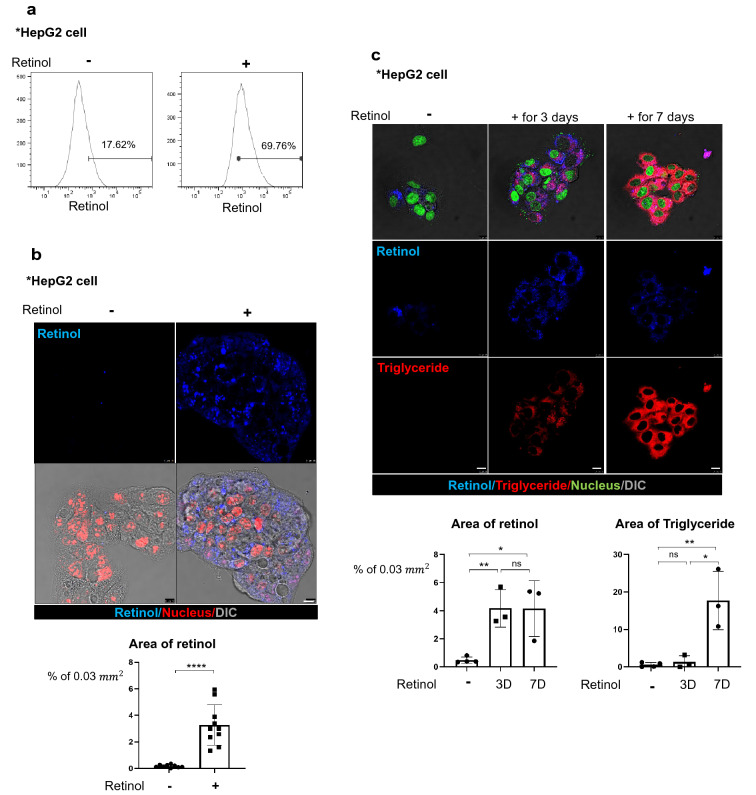
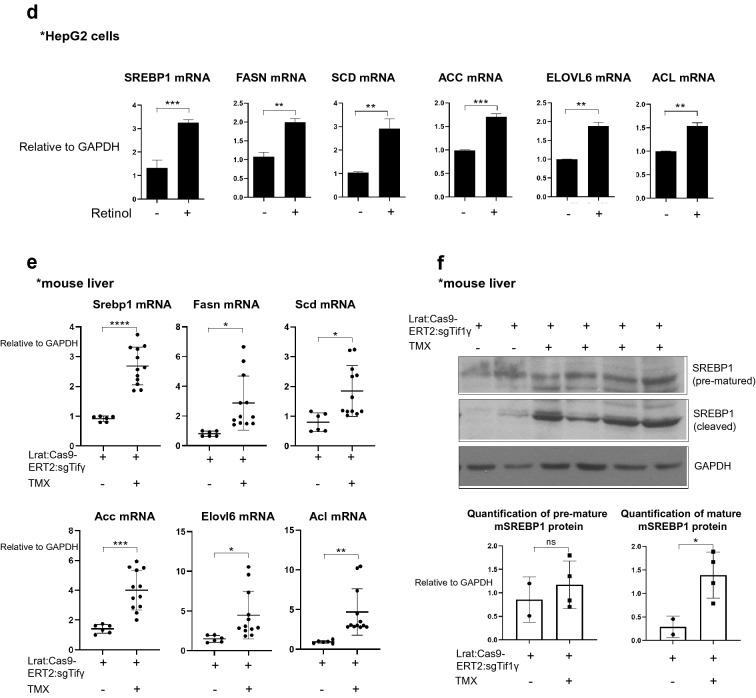
Retinol promotes the production of triglyceride in hepatocytes by increasing the expression levels of lipogenesis-related genes in vitro and in vivo. a Flow cytometric analysis using the autofluorescence of retinol. HepG2 cells were treated with or without 1 μm retinol (Ret) for 24 h, and were detected using a 450/50 filter and a 405 nm violet laser. HepG2 treated only with DMSO was used as the negative group, and retinol positivity was analyzed based on hoechst33258, which includes the excitation emission wavelength range of retinol. Reproducible result from two independent experiments was shown. b The accumulation of retinol (Ret; blue) in HepG2 cells treated with or without 1 μm retinol for 24 h. The nuclei were stained with SYTOX orange (red). Retinol-positive area % per 0.03 mm2 were quantified using Image J program. ****P < 0.0001 Scale bar: 10 μm. DIC, differential interference contrast showing the bright phase image of the samples. Reproducible result from three independent experiments was shown. c The distributions of retinol (Ret; blue) and triglyceride (red) in HepG2 cells treated with or without 1 μM retinol for 3 or 7 days. The retinol and its culture media were treated freshly every day because retinol is degraded easily.The nuclei were stained with SYTOX green. Retinol or triglyceride-positive area % per 0.03 mm2 were quantified using Image J program. Reproducible result from three independent experiments was shown. *P < 0.05, **P < 0.01, ns; non-significant. Scale bar: 10 μm. D. The expression levels of lipogenesis-related genes in HepG2 cells treated with or without 1 μm retinol in DMSO as negative control. hSREBP1: sterol regulatory element-binding transcription factor 1; hFASN: fatty acid synthase; hSCD: stearoyl-CoA desaturase-1; hACC: acetyl CoA carboxylase; hACL: ATP citrate lyase; hELOVL: ELOVL fatty acid elongase 6. Reproducible result from three independent experiments was shown. **P < 0.01, ***P < 0.001. e The expression levels of lipogenesis-related genes in the livers of Lrat:Cas9-ERT2: sgTif1γ mice treated with or without TMX (Lrat:Cas9-ERT2: sgTif1γ/Control n = 2, Lrat:Cas9-ERT2: sgTif1γ/TMX n = 3). The experiments were performed in triplicate. Unpaired Student’s t-tests were performed in Prism8. *P < 0.05, **P < 0.01, ***P < 0.001, ****P < 0.0001. F. The expression levels of premature and cleaved SREBP1 in the livers of Lrat:Cas9-ERT2: sgTif1γ mice treated with or without TMX(each line represented independent mouse). The expression level of GAPDH was used as a loading control. *P < 0.05, ns; non-significant


