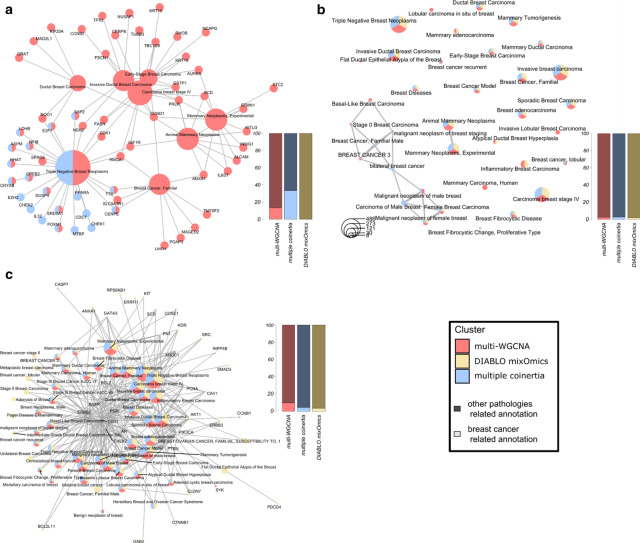
Fig. 5.
Comparison of extracted features by DIABLO (mixOmics), multi-WGCNA (MiBiOmics) and multiple co-inertia analyses (MiBiOmics). To compare the performance of each method, a gene enrichment analysis was performed using ClusterProfiler [28] and the DisGenNet (DGM) database [29]. a Diseases annotations from the DGM database and their corresponding genes associated to each subset of mRNA extracted features (DIABLO in yellow, multi-WGCNA in pink and Multiple co-inertia analysis in blue). b Diseases annotations from the DGM database associated to each subset of validated targeted genes by miRNA extracted features (DIABLO in yellow, multi-WGCNA in pink and multiple co-inertia analysis in blue). c Disease annotations from the DGM database and their corresponding proteins associated to each subset of protein extracted features (DIABLO in yellow, multi-WGCNA in pink and Multiple co-inertia analysis in blue). In each plot, the side bar plot indicates the proportion of breast cancer related annotations compare to the other pathologies associated terms

