
FIGURE 10.
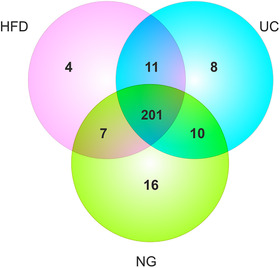
Venn diagram showing detected miRNAs (with > 5 normalized counts in all the samples within the isolation method group) in samples isolated by Hydrostatic Filtration Dialysis (HFD), ultracentrifugation (UC), and Norgen kit (NG)
Official websites use .gov
A
.gov website belongs to an official
government organization in the United States.
Secure .gov websites use HTTPS
A lock (
) or https:// means you've safely
connected to the .gov website. Share sensitive
information only on official, secure websites.
Venn diagram showing detected miRNAs (with > 5 normalized counts in all the samples within the isolation method group) in samples isolated by Hydrostatic Filtration Dialysis (HFD), ultracentrifugation (UC), and Norgen kit (NG)