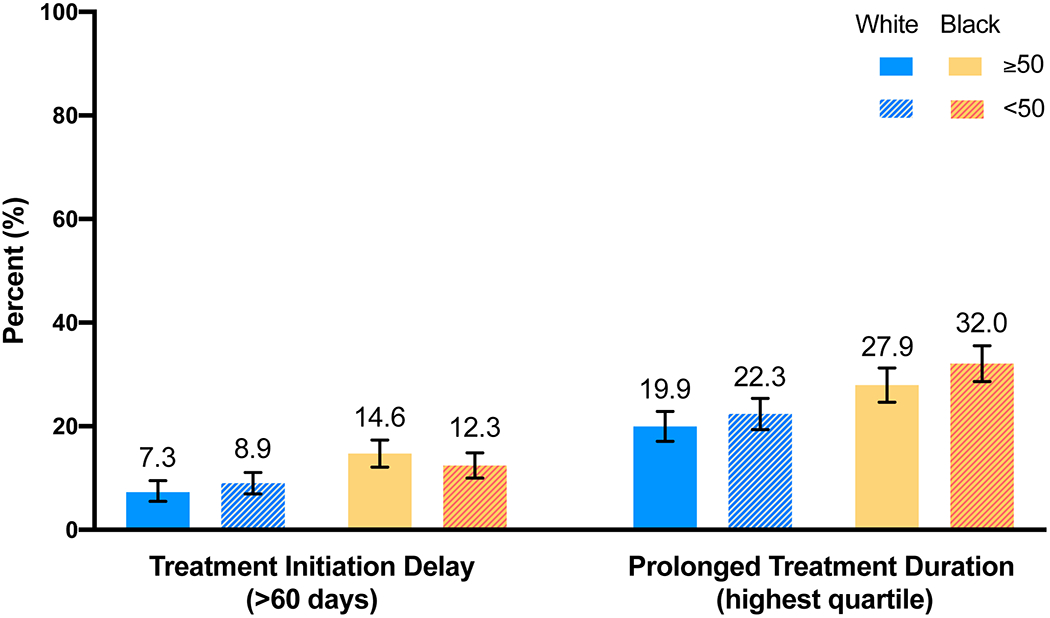
Figure 2. Proportions of delayed initiation and prolonged treatment duration by race and age in the Carolina Breast Cancer Study Phase 3 (2008-2013).

Each percentage represents a proportion of delayed initiation and prolonged treatment duration within each race and age category. Treatment initiation is defined by days since diagnosis. Treatment duration is defined based on quartiles of patients with the same treatment modality.
