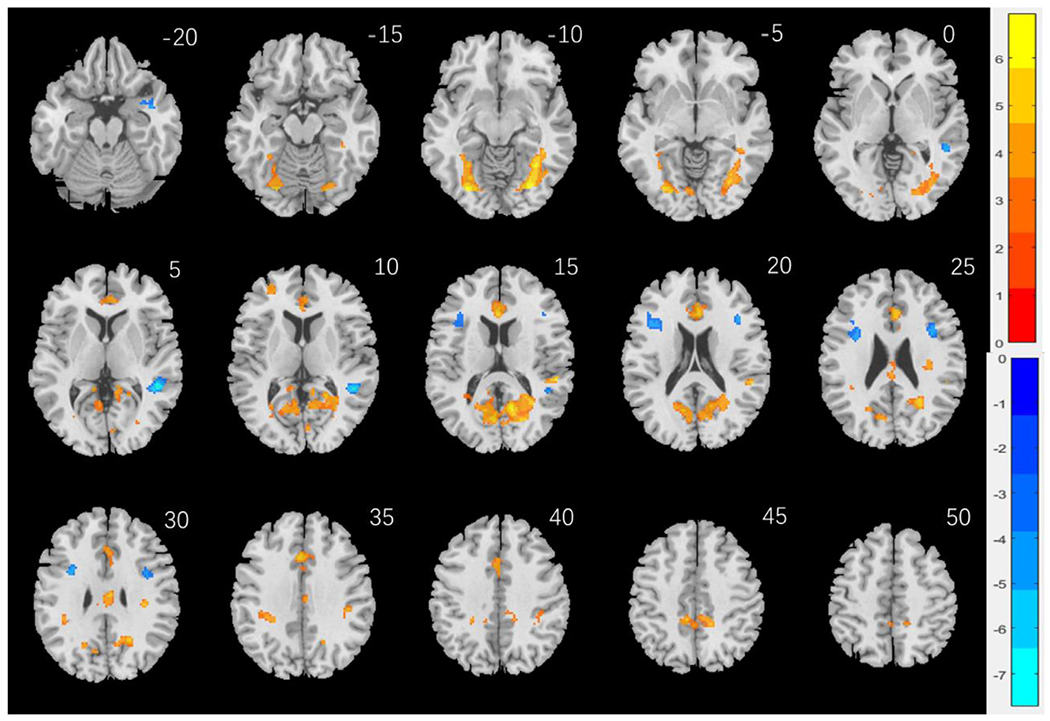
Fig. 2.

Sex differences in regional brain activations: Two-sample T test results of the contrast (face-shape) between men and women with age, years of education as covariates. Voxel p < 0.001, uncorrected. All clusters with cluster p < 0.05, corrected for family-wise error, are shown in Table 2. Color bars showed voxel T values; warm: men > women, cool: women > men. Clusters are overlaid on a T1 structural image in neurological orientation: right = right.
