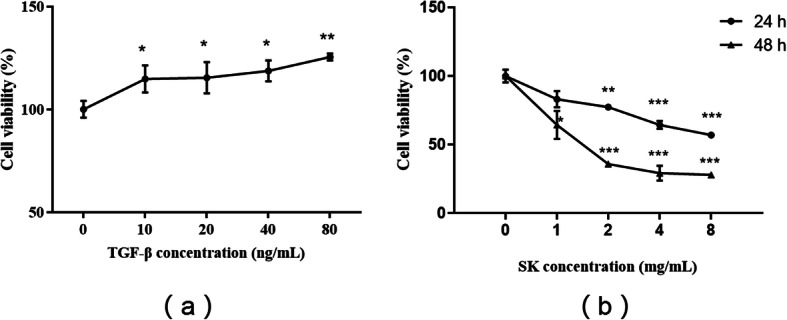
Fig. 1.

Effect of SK on NRK-49F cell viability after TGF-β1 treatment. The data are presented as the mean ± SEM. a Effect of different doses of TGF-β1 on cell viability calculated as a percentage of the viability of control cells after treatment for 24 h; *P < 0.05, **P < 0.01 versus 0 ng/mL TGF-β1 as a control. b Effect of different doses of SK on cell viability in the presence of 10 ng/mL TGF-β1 calculated as a percentage of the viability of control cells after treatment for 24 h and 48 h. *P < 0.05, **P < 0.01, ***P < 0.001 versus 0 mg/mL SK as a control
